The market dynamics are changing
Last Wednesday I discussed the loss
in the rally’s momentum (and breadth statistics) as a warning signal that a top
could be forming. As I mentioned, tops are a process. They rarely
take on a V-shape like bottoms do. Let’s look at some recent examples of markets
that lost momentum like we are seeing now, along with some thoughts on playing
them. In these examples I am going to be showing S&P 500 daily charts. The
indicator at the bottom is the 14-day RSI. (When it reaches 70 the line turns
red indicating it is “overboughtâ€.)
The 1st chart is a current view of the S&P 500. This index hit
its high on October 26th. Although it is now very close to breaking that high,
RSI is significantly lower. I have drawn a blue horizontal line to the right
from the 10/26 peak. This signifies that this was the day that RSI (potentially)
peaked.

Now let’s go back and look at other recent times when the
14-period RSI of the S&P 500 moved over 70 and then peaked…
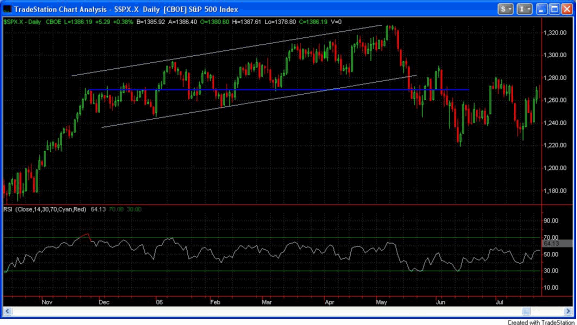
Below is a chart of the S&P 500 from October of 2005 to July
of 2006. In this case you’ll see that RSI peaked several months before prices
actually peaked. What we saw here was a continued series of less robust higher
highs that eventually led to the May/June selloff. The move from the low in
October to the momentum peak in November was good for over 7.5%. After RSI
peaked, the market had only 4.5% more upside over the next 5 ½ months.

Most notable about this from a trading standpoint is that the
character of the market changed. It went from a strongly trending market with
strong momentum to one that oscillated back and forth. In this case the
oscillations were within a rising channel. Choppy, oscillating markets are not
as kind to momentum, or trend-following strategies, as strongly trending markets
are. After RSI peaked, the easy money was no longer in the momentum names. The
easy money was made by those using overbought/oversold indicators to trade the
indices.
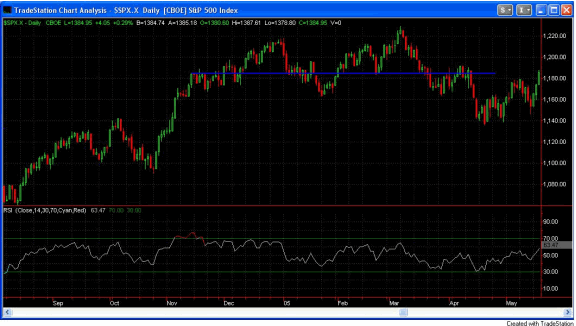
Here is a picture of the S&P 500 from August ‘04 to May of
‘05. Here again we see a momentum peak in November, followed by a market more
prone to oscillations than trends. In this case, the market basically moved
sideway for 4 months before the March/April selloff.

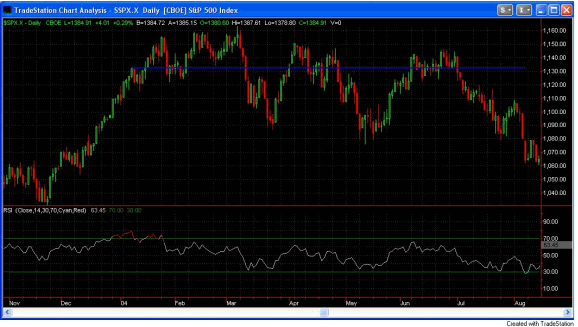
The next chart shows the S&P 500 from November of ’03 to
August of ’04. In this case, RSI peaked in early January, which is about 2
months before the actual peak. Once again, though, as soon as momentum peaked,
the market’s character changed from trending to oscillating. This eventually
concluded with the selloff into August of ’04.

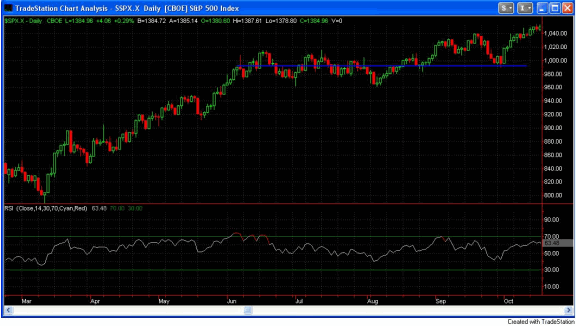
In June of 2003 we saw another overbought RSI peak. This did
not conclude with a top, but it did lead to 4 months of consolidation and
oscillations.

As we’ve seen, many times the RSI will peak well ahead of
price. (This is not always the case — check out May of ’01 for an example of
when they peaked at the same time. This was followed by a down trending channel
before the real selloff began in late August ’01.) It appears to me that RSI has
likely peaked again.
So does this mean the market is forming a top? Not
necessarily. It’s possible we could consolidate around these levels and then
embark on another leg higher like the 2003 example. I think that’s unlikely,
though. Regardless, the character of the market is changing and your approach
should as well. I believe it is time to utilize strategies that would take
advantage of oscillations as opposed to strategies that would take advantage of
momentum. Take what the market gives you and understand that the up-move is
likely weakening.
Best of luck with your trading,
Rob
For those who may be looking to expand their
knowledge beyond just market timing, my
Hanna ETF Money Flow System utilizes the VIX in generating trading
signals for spread trades.
Rob Hanna is the principal of a money
management firm located in Massachusetts. He has spent the last several years
developing and refining methods for trading in stocks across multiple time
frames. He selects stocks using both fundamental and technical criteria, and
then trades them using technical analysis techniques.
