The Market is a Drug Addict Dependent on the Fed
From 1990 to 1997, Kevin Haggerty served as Senior Vice President for Equity Trading
at Fidelity Capital Markets, Boston, a division of Fidelity Investments. He was responsible for all U.S. institutional Listed, OTC and Option trading in addition to all major Exchange Floor Executions. For a free trial to Kevin’s Daily Trading Report, please click here.
Commentary for 1/11/11
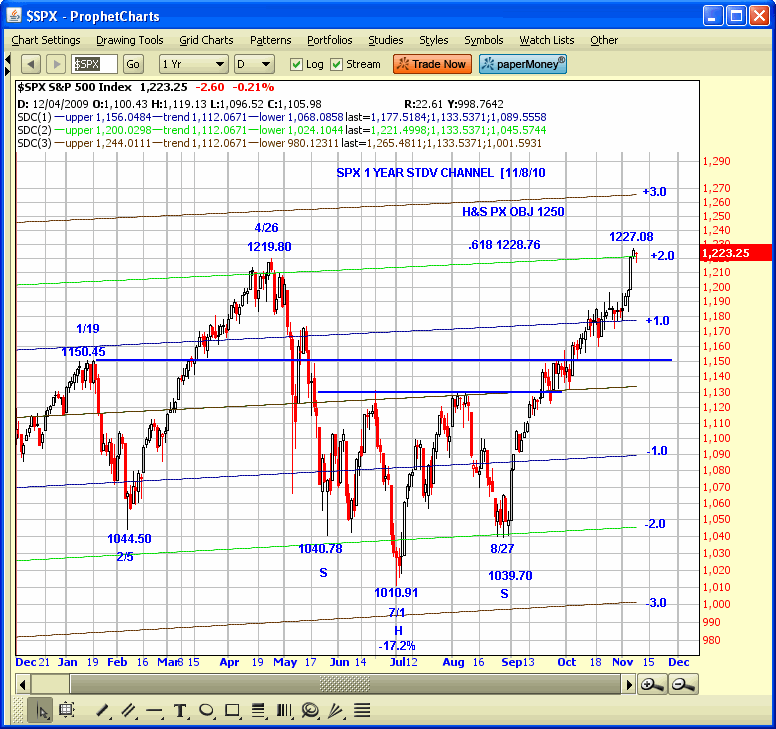
The SPX finished the first week of 2011 +1.0% to 1271.50, and is extended to the +2.0 STDV zone on the 1 year STDV Channel chart. All of the bullish sentiment indicators remain extended to 2007 bull market top comparisons. The USD was +2.8 last week and the XEU -3.8. The gold sector continued to correct as the HUI was -7.5 on the week and GLD -3.9, while crude oil [USO[ was -3.8 and the TLT -2.0.
Last week was the 6th straight weekly gain for the SPX, and with higher highs and higher lows, while the 5WK RSI hit 86.67 versus 89.13 at the April 1219.80 high preceding the -17.2% decline to the 1010.91 July low, and 91.15 at the previous 1227.08 Nov high before the -4.4% decline to 1173.
Jan has some significant time symmetry and the initial fib extension leg of the last major leg down from 1219.80 [4/26/10] to 1010.91 [7/1/10] is 1276.82, which is the 1.272 extension. The SPX has been churning at that level for the last six days with intraday highs of 1276.17, 1274.12, 1277.63, 1278.17, 1276.83, and 1271.52 yesterday.
It is not a question of if there will be a correction because the market is so extended, but if the earnings season hype can delay it longer in addition to the Fed`s POMO Ponzi scheme which has kept the equity market up since July without a meaningful correction, but is not preventing interest rates from rising despite the Fed`s Treasury Bond purchases.
The SPX has taken out the 1228.76 .618RT zone from 667-1576 and this means the odds favor a move to the next zone which is 1309.66 and the 1.414 fib extension of the 1219.80-1010.91 leg at 1306.28. There are Gann Angles at 1301.50 and 1310.54.
The SPX churning at the 1276.82 level the last 6 days has led to profitable intraday shorts for day traders, and the 3 pullbacks to 1262.66, 1261.70, and 1262.18 yesterday versus the previous 1260-1267 price symmetry zone, have resulted in very profitable strategy long setups, not just for the SPX, but for many of the focus list stocks in my daily Trading Service.
The extended market is obvious, and there is symmetry, but as I said in the last commentary, there is no change in short term trend by definition until there is a lower high and lower low in the SPX etc, and right now there hasn`t even been a close below the 8DEMA since 11/30/10.
Have a good trading day!

Click here to find full details on Kevin’s courses including Trading with the Generals with over 20 hours of professional market strategies
. And for a free trial to Kevin’s daily trading service, click here.
