The market is at critical levels right now
Commodity indexes and important
commodities are starting to make a critical test of key levels this week
that investors should monitor to determine how quickly the economic slowdown
we’ve been expecting will materialize.
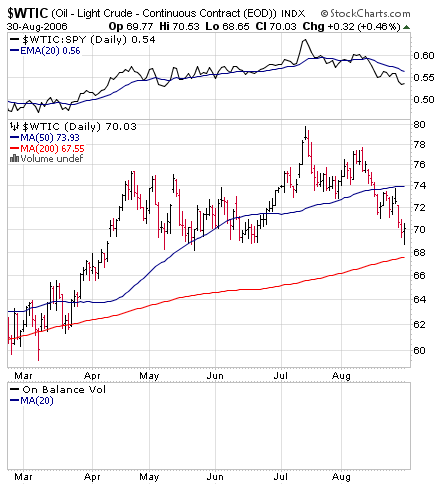
Oil prices are testing the last support that produced a rally
to new highs, at the 68 level, which happens to coincide with 200-MA support.
NORMALLY oil would decline in the event of a substantial slowdown in US growth,
especially if accompanied by a global slowdown that we suspect is following the
US one. It may well be however that this time oil stays up better than most
other economically sensitive commodities because of geopolitical instabilities
as well as the fact that global supplies have not yet picked up despite higher
prices. Yet if oil breaks 68 and the 200-MA on a weak close, this will indicate
more trouble intermediate-term for commodities and that the economic slowdown is
clearly materializing.

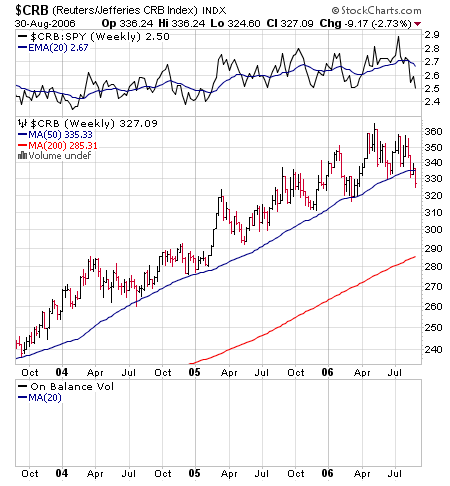
The CRB index has already broken down through its
200-MA
support and broken its weekly uptrend channel support line in place since 2003.
This indicator is already signaling a slowdown. A test of the 316-320 level
looms.
Gold is also getting close to some important support levels
here. A descending triangle has formed with support at 600 (60 basis the 1/10
GLD shown below). The 200-MA is coming up just a tad below this level as well. A
breakdown and week close below 60 and the 200-MA on GLD would paint a negative
growth scenario unfolding and possible new leg of underperformance for resources
and materials. A breakout over 640 would negate the potential breakdown in GLD.
Note that silver is much stronger than gold and is not signaling the technical
problems GLD would signal if it broke 60 and the 200-MA.

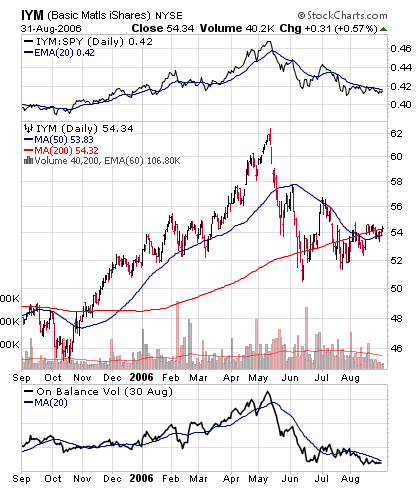
Materials stocks have been underperforming since May and look
similar to GLD.
(
IYM |
Quote |
Chart |
News |
PowerRating), the materials i-share is stuck in a triangle and its
breakout of this pattern could be used to confirm a plurality of positive or
negative moves by
(
GLD |
Quote |
Chart |
News |
PowerRating), oil, and commodity indexes to help investors ascertain
whether there will be some breathing room for a spell or a quick move toward the
slowdown that is developing economically. If these can all hold and move above
resistance higher, the market should be able to move irregularly higher for some
weeks before fears of the slowdown begin to exert more influence. But if these
all breakdown, the market will likely have trouble not reacting negatively to
the growing focus of economic slowdown ahead.

We still like the sidelines and bonds better than stocks in
general, or relative long/short pairs that we’ve been mentioning for some time.
Housing indexes are falling at a swift enough pace now, that investors,
particularly those with lingering net long exposure, should begin to watch out
for a clear plurality of indicators showing that the focus is shifting toward
fear of the growth slowdown. We suspect this will develop at some point before
the end of the year — and with September and October historically the most
bearish months of the year, investors should monitor signals of distress.
Internal breadth is improving some, but is still below levels
normally associated with a sustainable bull market move. We continue to rate the
macro environment as not highly reliable (except perhaps for bonds and
(
TLT |
Quote |
Chart |
News |
PowerRating),
which are likely to beat cash as the US slows down and have broken out of a base
recently). Investors should continue to skeptically let market action be the
guide. Strong rallies in the major averages accompanied by high volume to create
a couple more follow-through days would be the first sign of more upside ahead.
The real excitement may not come until the breadth of Top RS new highs starts to
expand broadly and stocks meeting our runaway up fuel criteria begin to break out
with some plurality. Until then, we still suggest keeping your powder mostly
dry. We continue to suspect that breaking above 1320-27 and making new highs
will be difficult for the market to do unless better volume and breadth
materializes. We continue to regard this as a TREACHEROUS ENVIRONMENT where
CAPITAL PRESERVATION SHOULD BE PARAMOUNT. Don’t allocate heavily to anything
that doesn’t scream at you.
Lots of bonds and cash seem prudent here until the environment
becomes clearer. Long/short pairs can be sparingly participated in as well
.
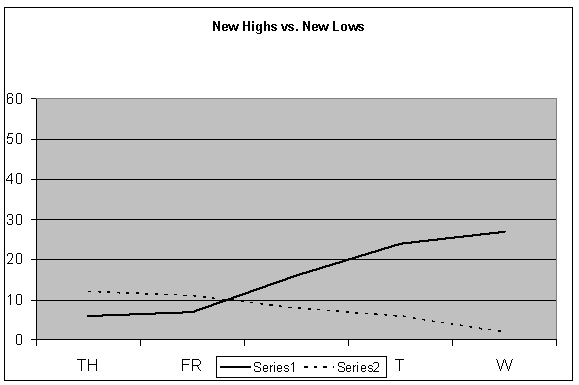
Our US selection methods, our Top RS/EPS New Highs list
published on TradingMarkets.com, had readings of 6, 7, 16, 24 and 27 with 12
breakouts of 4+ week ranges, no valid trades meeting criteria, and no close
calls. This week, our bottom RS/EPS New Lows recorded readings of 12, 11, 8, 6
and 2 with 2 breakdowns of 4+ week ranges, no valid trades and no close calls.
The “model†portfolio of trades meeting criteria has some time back exited all
positions and is 100% in cash.

Mark Boucher has been ranked #1 by Nelson’s World’s Best Money Managers for
his 5-year compounded annual rate of return of 26.6%.
For those not familiar with our long/short strategies, we suggest you review my
book "The Hedge Fund Edge", my course “The
Science of Trading“, my video seminar, where I discuss many new techniques,
and my latest educational product, the
interactive training module. Basically, we have rigorous criteria for
potential long stocks that we call “up-fuel”, as well as rigorous criteria for
potential short stocks that we call “down-fuel".
