The Market Rally and Reality
Kevin Haggerty is a
full-time professional trader who was head of trading for Fidelity Capital
Markets for seven years. Would you like Kevin to alert you of opportunities in
stocks, the SPYs, QQQQs (and more) for the next day’s trading?
Click here for a free one-week trial to Kevin Haggerty’s Professional
Trading Service or call 888-484-8220 ext. 1.
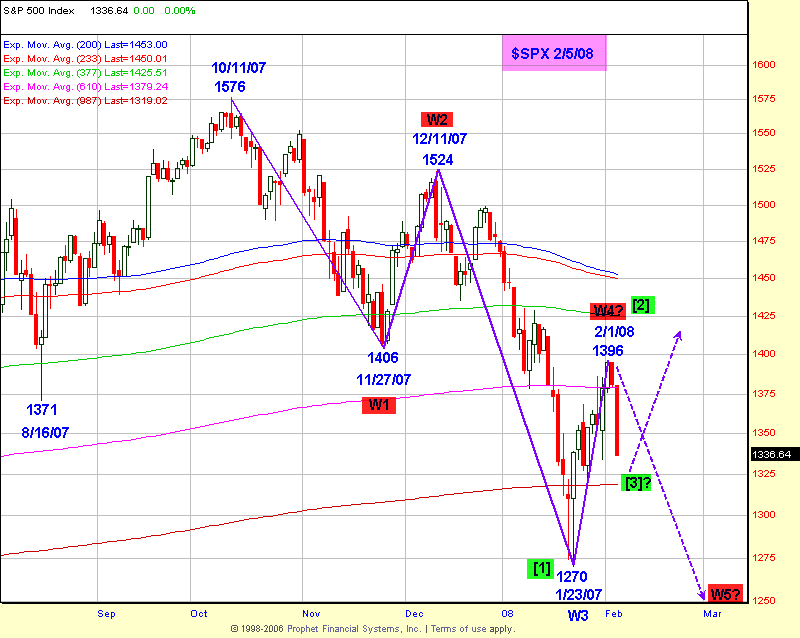
Last Friday on 2/1, I said that if the SPX +21 point pre-market futures gain
carries through the open, it would put the next price zone in play, and that
1394 was the .50 retracement in percentage to 1576, while the .50 retracement in
points was 1423. The SPX made a 1396 high on 2/1, and declined -1.1% on Monday
(2/4) to 1380.82, and this was followed by the -3.2% meltdown yesterday to a
1333.64 close. This was accelerated by the negative ISM Non-MFG 41.9 number. I
also said in that same commentary that the SPX would decline again to test the
1270.05 1/23/08 low, or make a lower low before this bear market ends, which is
what I think is the highest probability.
It wasn’t rocket science to anticipate a decline from a key price and time
zone after the SPX had gained +9.9% in 8 days, while the $BKX was +29.0% and the
$XBD was +25.7%, both of which were just below the .50 retracement levels to
their bull cycle highs. The $BKX is -7.8% and $XBD -7.5% so far this week, while
the SPX is -4.3%, and the $INDU -3.8%. NYSE volume was 1.67 billion shares
yesterday in the meltdown. The 4 MA’s of the volume ratio and breadth on 1/31
were 67 and +988, both ST-OB as you would expect after the 8-day vertical move.
The SPX had closed at 1395.42 on Friday (2/1) and the 4-MA’s were 67 and +1013.
The primary time symmetry for 2/4 was that it was the 2.0 ratio (78 TD’s) of the
39 trading day leg up from the 8/16/07 1371 low to the 10/11/07 1576 bull market
high. It was also 36 TD’s from the previous 12/11/07 1524 high. 36 is a natural
square number (6×6) and is more significant when there is other key price and
time symmetry, which there certainly was in this case, and had been previously
outlined in the Trading Service commentary. These are some of the principles
that comprise my "Core Framework" for high probability trading, which are a key
part of the Trading Service. There is no hindsight involved, and all you have to
do is take a free trial to the service and read through the archives of the
commentaries, to see how these principles are anticipated in front of the
significant market moves we have had, including the 10/11/07 bull cycle high.
The SPX made a 1336.70 intraday low yesterday, versus the 1333 .50
retracement to 1270.05 from 1396, while the .618 retracement is 1318. We can’t
know whether the SPX will make a 1-2-3 higher bottom and run to the 1423 .50
retracement zone first, or whether the 1396 high will hold up, and if the SPX
will take out the 1270.05 low for a Wave 5 down (see chart). However, I don’t
think that 1270.05 is the bear cycle low. The initial resistance on any bounce
today will be Volatility Band levels at 1356 and 1361, followed by the 1364-1371
zone.
Check out Kevin’s strategies and more in
the
1st Hour Reversals Module,
Sequence Trading Module,
Trading With The Generals 2004 and the
1-2-3 Trading Module.
Have a good trading day, and Go Giants.
Kevin Haggerty

