The Market Rings a Bell at Key Price and Time Zones
From 1990 to 1997, Kevin Haggerty served as Senior Vice President for Equity Trading at Fidelity Capital Markets, Boston, a division of Fidelity Investments. He was responsible for all U.S. institutional Listed, OTC and Option trading in addition to all major Exchange Floor Executions. For a free trial to Kevin’s Daily Trading Report, please click here.
Commentary for 6/23/11
First we get Bernanke talking down the economy Wed, and then tells us that he doesn`t know why long term growth is so slow. This was preceded recently by the “no nothing about business” President standing in front of his telepromter and telling the country he has created over 2 million private sector jobs. Yesterday, we got a bizarre release of oil reserves by the IEA and US from the Strategic Petroleum Reserve, which amounts to nothing relative to world consumption, and seems to be nothing more than a desperate political play.
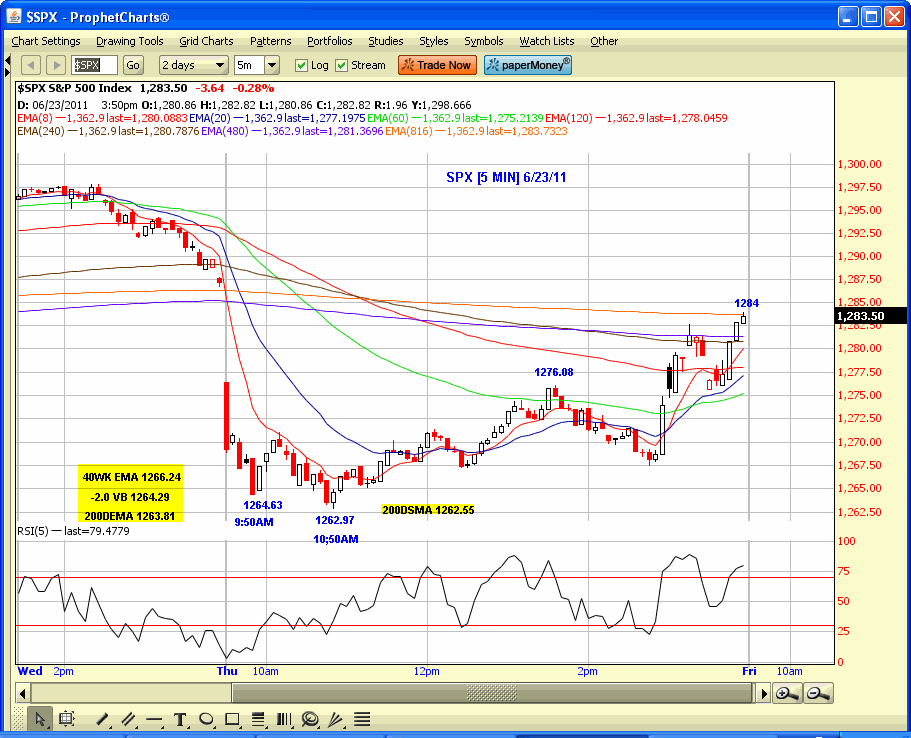
The market had a significant gap down opening yesterday, and Crude was down almost -5.0% at one point, and the USD was up over +1.0%, while the commodity sectors tumbled, and the Bond market rallied. The SPX traded down to the -2.0 Volatility Band and long term moving average price zone with a 1264.63 low on the 9:50AM bar, bounced to 1271.04, made a marginal low at 1262.97, and then trended up an closed at 1283.50.
This is a key price and time zone that includes the 1266.24 40WK EMA, 1263.81 200DEMA, and 1262.55 200DEMA. The time symmetry is the 6/13/11 [2011.45] 8.6 year Economic Confidence Model cycle
[M. Armstrong]. When you have price and time symmetry it has to be confirmed by other technical evidence indicating an O/S or O/B condition. If you get all three components there is a high probability for a reversal with a positive mathematical expectation of success. In this case the SPX had declined -7.6% to the 6/13 1265.64 low, and was O/S on both the weekly and daily charts all the symmetry was in sync.
The SPX has formed volatile 9 day range since the 6/13 1265.64 low as it advanced +2.1% to 1292.50 on 6/14, then -2.7% to 1258.07 on 6/16, followed by a +3.2% move to 1298.61 on 6/22, and then -2.8% yesterday to the 1262.87 low, and +1.7% so far to yesterdays 1284 high. The low close of the 9 day range is 1265.42 so it is still holding the key price zone despite a barrage of negative news.
You were also aware of the previous key price and time zone in late April and invited to take a free one week trial to the Trading Service which explained the symmetry in more detail The SPX had declined 17.2 months
[2 x 8.6] from the 1576 10/11/07 top to the 667 3/6/09 bottom. There are 25.8 months [3 x 8.6] from the 3/6/9 low to 4/24/11, and the closing bull cycle high was 1363.61 on 4/29/11, which is also a long term Pi date.
The SPX made the cycle high on 5/2/11 at 1370.58, versus the 1.272 Fib Extension of the 1344.07 [2/18/11] to 1249.05[3/16/11] leg at 1369.92 The technical confirmation was that the SPX 5 month RSI was 85, which was the most O/B since the 2007 bull market high. I said not to touch the market on the long side in that zone, and should reduce equity allocations and /or hedge existing positions.The 2002-2007 bull cycle was +105%, and the move from 667 to 1371 was also +105%.
You can identify high probability turning points, but can`t know with any certainty the extent or duration of a move. If the current zone is broken the crowd points to 1249.05 as the next key level, but there is more symmetry at the 1228.75 .618RT to 1576 from 667, as key levels broken on the upside act as major support on the downside. I don`t think a rally from this zone will be sustained and take out the 1370.58 cycle high this summer. If the current key price zone is broken there will probably more of an air-pocket than expected, and probably take out that 1249.05 low.
I included the SPX 5 min chart from yesterday to point out how daytraders were able to capitalize on the extended -2.0 VB level and long term MA symmetry. Emotion means opportunity for the day trader, and you can go home flat each night and just hope there is more off the wall news the next day.

Click here to find full details on Kevin’s courses including Trading with the Generals with over 20 hours of professional market strategies. And for a free trial to Kevin’s daily trading service, click here.
