The Market Time Period Red Alert
From 1990 to 1997, Kevin Haggerty served as Senior Vice President for Equity Trading at Fidelity Capital Markets, Boston, a division of Fidelity Investments. He was responsible for all U.S. institutional Listed, OTC and Option trading in addition to all major Exchange Floor Executions. For a free trial to Kevin’s Daily Trading Report, please click here.
Commentary for 5/2/11
In the previous commentary I mentioned that there was some key time symmetry for the last week of April and Mid-June, and that you could access this information with a free trial to the Trading Service and checking the commentary for 4/19/11, which was posted after the close on 4/18/11.
In the TS commentary for 4/20/11 I said that “the market rarely accommodates your desired scenario, but I would rather see the SPX take out the SPX 2/18/11 1344.07 cycle high after a rally starting around the 4/24 time date, and then advance into late May to Mid-June, which is a significant longer term 8.6 year cycle date [M. Armstrong].
Before the FOMC meeting, I said that regardless of the proposed end of QE2 in June that the Fed will have to maintain an accommodative stance and would not just end the program “cold turkey”.
The market anticipated it the same way as the USD declined 3 straight days going into the long weekend in front of the FOMC meeting on 4/26 and 4/27, while the SPX advanced for the same period. Bernanke didn`t disappoint, and indicated that there will be no definitive end to low interest rates and stimulation despite ending QE2, because in reality the economy is not as strong as hyped in the mainstream media. The market responded and the USD has now declined 8 straight days, while the SPX is up 7 of the last 8 days. Bernanke`s statement accelerated the move in risk assets, especially crude oil and precious metals driven by the weaker US Dollar, while gold and silver are in parabolic advances, with gold up 9 of the last 10 days.
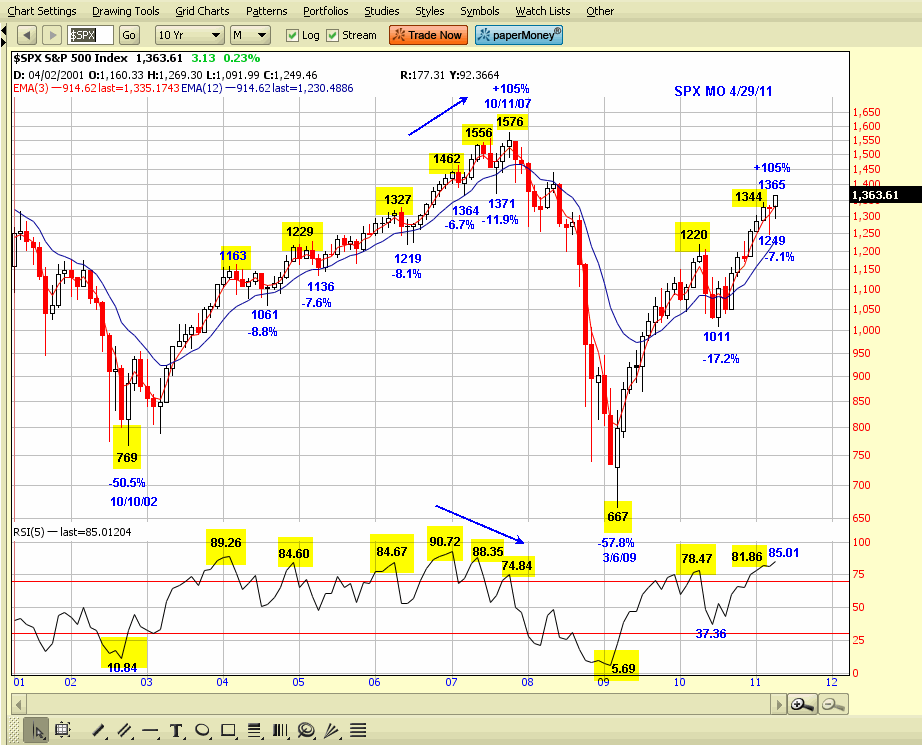
The SPX is +4.4% in the last 8 days, and many of the Trading Service Focus list multinational stocks have gone vertical for the same period, and are up anywhere from +8% to +12% to higher cycle highs. The market remains extremely O/B as indicated by the SPX long term monthly chart, and has taken out the 1344.07 high by accelerating in the 4/24 time period.
I included the monthly SPX chart because the monthly 5 RSI indicator is excellent for identifying extended high probability reversal zones, and we are in an obvious extended zone now coming into May, and then the Mid-June 8.6 year cycle date. The SPX had the “crisis” -7.1% air-pocket when the 5 RSI was above 80, and now the SPX has made a +9.3% advance from 1249 to 1365, and the 5 RSI finished at 85.01 as the 3 month EMA has gone vertical, so the crowd that plays the seasonal trade bought the SPX at 1183 at the end of OCT 2010 and is +15.4% into the end of April 2011 to 1364, and ready to sell them in May and go away. Remember, they sold the SPX in the end of April 2010 at 1187, and avoided the -17.2 % decline.
The “Crowd” is all on the same side of the trade and totally complacent about the Feds ability to accommodate higher prices, but that is fragile, just as we saw with the -7.1% “crisis” decline in mid-March with the monthly
5 RSI at 81.86 as indicated on the chart. The market is now in the historically weaker seasonal period, and there is a key cycle date on June 13, so the odds favor a reversal, especially with the monthly 5 RSI at 85.01.
The next commentary will be Friday 5/6/11.
Have a good trading week!

Click here to find full details on Kevin’s courses including Trading with the Generals with over 20 hours of professional market strategies. And for a free trial to Kevin’s daily trading service, click here.
