The next big move could be down
The indexes
finished mixed for the week once again, despite aggressive selling pressure in
prior market leaders. With the exception of Friday, sectors such as Chips,
Internet, Energy and Precious Metals were under pressure, as money appeared to
being moving into defensive shares (e.g. PG). The main catalyst for the
weakness appeared to be worries over interest rates rising globally. Also,
there seemed to be a fundamental shift in the way institutions were allocating
money, as most companies which often thrive during economic expansion were the
weakest. It was also noteworthy that market internals showed some
deterioration.
While the
week ended on a positive note Friday, the action seen earlier in the week didn’t
appear to be very healthy. It wasn’t just the weakness either, as technical
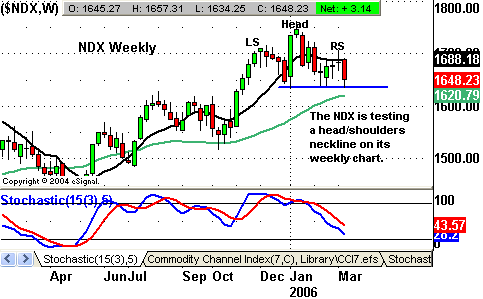
deterioration also took place. The NASDAQ 100 (NDX) appears to have put in a 3rd
“lower high”, while the index also recorded a new low for the year on Thursday.
The NASDAQ Composite appears to be holding up a little better, however, it does
appear to be displaying a classic topping formation. In addition, the index
finished below its 50-day moving average on Tuesday. Without the NASDAQ
displaying the leadership it’s shown in previous months, extra caution is
warranted on the long side.
Equally
troubling is the fact that money is beginning to rotate into Consumer Staple
shares, which usually thrive prior to an economic slowdown/recession. It’s no
secret that Q1 GDP is expected to be very healthy. The warmest January on
record, coupled with holiday spending, has likely set the stage for economic
growth near 5%. However, Q1 is likely to be an aberration. When looking out
later in the year, one cannot help but become concerned over an economic
slowdown in connection with rising rates. Should the Fed continue to stay on
the same hawkish path that it’s on currently, it’s very possible that the next
big move could very well be to the downside.

Daily Pivots for 3-13-06
Symbol |
Pivot |
R1 |
R2 |
R3 |
S1 |
S2 |
S3 |
|
INDU |
11049.42 |
11125.91 |
11175.49 |
11251.98 |
10999.84 |
10923.35 |
10873.77 |
|
SPX |
1279.02 |
1286.93 |
1292.28 |
1300.19 |
1273.67 |
1265.76 |
1260.41 |
|
ES M6 |
1289.75 |
1298.75 |
1304.50 |
1313.50 |
1284.00 |
1275.00 |
1269.25 |
|
SP M6 |
1289.75 |
1298.75 |
1304.50 |
1313.50 |
1284.00 |
1275.00 |
1269.25 |
|
YM M6 |
11120.67 |
11205.33 |
11258.67 |
11343.33 |
11067.33 |
10982.67 |
10929.33 |
|
BKX |
105.87 |
106.56 |
107.01 |
107.70 |
105.42 |
104.73 |
104.28 |
|
SOX |
504.40 |
508.60 |
514.87 |
519.07 |
498.13 |
493.93 |
487.66 |
Please feel free to email me with any questions
you might have, and have a great trading week!
Chris Curran
Chris Curran started his trading career at the
age of 22 with a national brokerage firm. He combines fundamental and technical
analysis to get the big picture on the market. Chris has been trading for 15
years, starting full time in 1997, and has never had a losing year as a
full-time trader.
