The Next Important SPY Time Date Is Approaching
Kevin Haggerty is the former head of trading for
Fidelity Capital Markets. His column is intended for more advanced traders. If
you would like to learn how Kevin trades,
you can find more information here.
The month ended with a -0.8% day for the SPX
(
$SPX.X |
Quote |
Chart |
News |
PowerRating) and was +0.1% for the week. The Dow
(
$INDU |
Quote |
Chart |
News |
PowerRating) was -0.6% to
10,641 and -0.2% on the week. The
(
QQQQ |
Quote |
Chart |
News |
PowerRating) managed to finish -0.5% on the
week, despite a -0.8% day on Friday. NYSE volume was 1.38 billion shares, the
lowest volume since last Monday’s 1.3 billion shares. The Generals did their
thing for three days in succession with the SPX +0.2%, +0.5% and +0.6% prior to
month-end’s -0.8% on Friday. The regulators frown on any “aggressive mark-ups”
the last day of the month, quarter, etc., so nobody was rushing in to take
prices above Thursday’s 1245.15 new rally high, and certainly not the hedge
funds if there were no significant Generals’ buy orders to front run on a
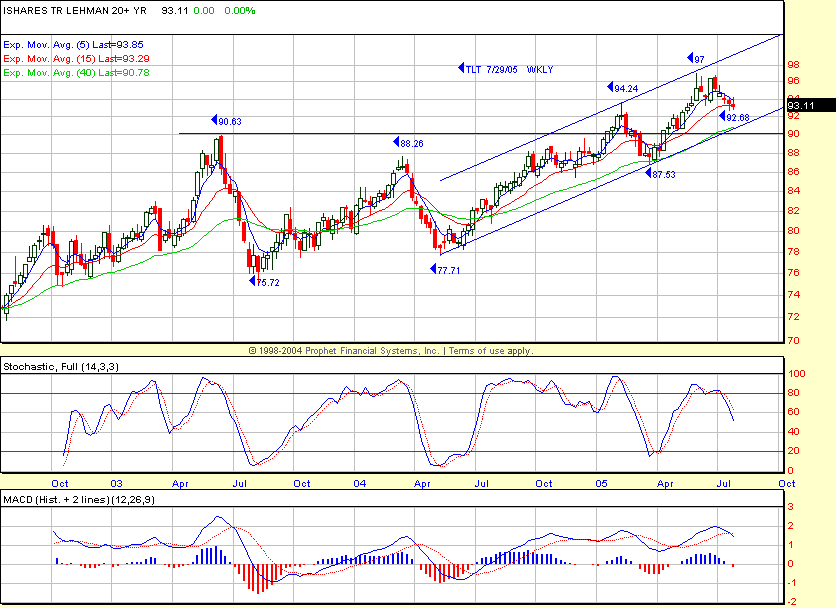
mark-up. The weakest sectors last week were the financials, with the
(
TLT |
Quote |
Chart |
News |
PowerRating)
-0.4% on the week along with the BKX, -1.5%, and XBD, -0.4%. The rest of the
sectors finished on the green side led by the
(
OIH |
Quote |
Chart |
News |
PowerRating), +1.6%, RTH, +0.8%, and
the
(
SMH |
Quote |
Chart |
News |
PowerRating), CYC and PPH, all about +0.4%.
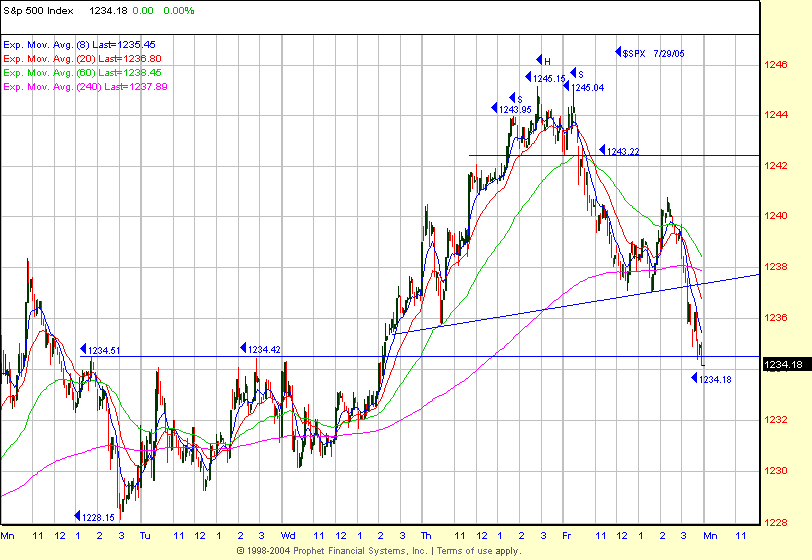
The SPX hit the .618 retracement zone to 1553
with a 1245.15 intraday high vs. the 1254 actual .618 level, just +0.07% above
1245.15. Daytraders capitalized on the H&S/double top with short entry below
1243.22 which traded down to a 1234.18 low and close.
The SMH worked its way down from an opening-bar
high of 37.42 to a 37.10 intraday low on the 12:30 p.m. ET, which set up an RST
long entry above 37.13, which ran +1.1% to 37.55 before reversing on an RST
short entry below 37.51 with entry on the 2:10 p.m. bar. This trade only
declined to 37.33 before closing at 37.36. Both the RST long and short were
clearly defined, by-the-book intraday entries with nothing subjective about
them. Both RSTs were staring you in the face, so if you failed to take either
one, look inside yourself for the reason because it’s not the strategy’s
problem, it’s yours.
We are now in the real dog month of summer as the
August volume is generally to the low side and liquidity thin which can lead to
some downside air pockets, especially as the SPX approaches the 1254 .618
retracement to 1553 with the 1245.15 intraday high and 1243.72 close. In fact,
the August/September combination is probably worse than the month of August as
there have been many selloffs into September and October.
The next primary Fibonacci time ratio for the
(
DIA |
Quote |
Chart |
News |
PowerRating)/
(
SPY |
Quote |
Chart |
News |
PowerRating), measured in trading days from the 10/25/04 97.27 low to the
04/20/05 99.89 low is the 1.618 ratio on 08/05, which is next Saturday, so your
zone is +/- a couple of days on each side of next weekend.
This is being recorded Sunday night for Monday.
Have a good trading day,
Kevin Haggerty
P.S. I will be
referring to some charts at
www.thechartstore.com in the future.


