The Numbers Show That Buying Weakness Works On A Long-Term Basis Too
Below we have a
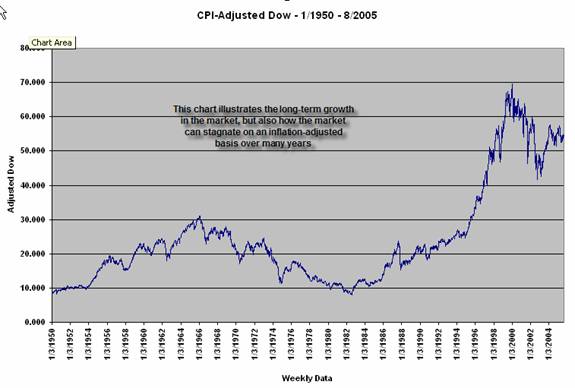
long-term chart of the Dow Jones Industrial Average from January, 1950 through
early August, 2005. Note that the Dow has been adjusted for the
Consumer Price Index (CPI) to reflect the impact of inflation on stock prices.
Although the nominal Dow moved from approximately 200 to over 10,000 during that
time (a fifty-fold gain), the inflation-adjusted change has been from about 8.5
to 54–a bit over a six-fold appreciation. Even without dividends factored into
this chart, which would certainly enhance the total return of the Dow, we can
observe a long-term pattern of stock market appreciation. We can also observe,
from 1966 to 1982, a considerable period of negative returns in the market. This
sixteen-year period is similar to the period of negative returns in the market
from 1929 through 1949. Despite the bull market of the past 2-3 years, we remain
well below the inflation-adjusted Dow peak of January, 2000. Such periods of
negative return (which currently exceed five years for the Dow) have not
typified the secular periods of long-term market appreciation since 1950 (i.e.,
we did not see five-year periods of negative return from 1950-1966 or from 1982
to 2000). The only time since 1950 we have seen five-year periods of negative
return has been during the inflation-adjusted secular drought between 1966 and
1982.
This, I believe, is the critical call that
long-term investors need to make in today’s market: Have we entered a period
of prolonged market underperformance on an inflation-adjusted basis (and a
possible pattern of lower highs and lower lows on a long-term basis), or will we
likely resume the long-term appreciation that has characterized the American
stock market?
Here are a few findings that highlight the importance of the issue:
The current three-year (150 week) rate of change on the inflation-adjusted Dow
is about 40%. From 1950 to 2003 (N = 2652), the market has been up by more than
that amount on 761 occasions. One year (50 weeks) later, the market was up 533
times, down 228, for an average gain of 10.22%. This is slightly better than the
8.18% average yearly appreciation in the adjusted Dow over the entire sample
(1797 up, 855 down). In other words, overall from 1950-2003, there was no added
risk associated with buying the market even after a three-year
inflation-adjusted rise of over 40%.
If, however, we examine the period from January, 1962 to September, 1981 (N =
1028), we find a very different story. When the adjusted Dow over a 150 week
period was up over 40% (N = 50), the market one year later was down by an
average -8.06% (13 up, 37 down). That is a much worse performance than we see
for the remainder of the sample (N = 978), which displayed an average yearly
change of 2.83% (572 up, 406 down).
One interpretation is that buying strength in a secular bull market can make you
money. Buying strength in a secular bear phase can bring subnormal returns. Your
decision to buy and hold stocks at this juncture should be predicated on your
assessment as to whether stocks in 2000 saw a secular high (as in 1966), as
opposed to a temporary peak on the way to historic highs. One clue in this
puzzle might be long-term interest rates. Note that the bull phase from 1950 to
1966 saw a strong bond market (falling rates), while the period from 1966 to
1982 was characterized by high inflation and high interest rates. We again saw
rates move lower after 1982, fueling the subsequent bull market, only to turn
higher recently. The question as to whether or not we’ve seen a secular high in
stocks may hinge on whether or not we recently reached a secular low in interest
rates.
I don’t pretend to have a crystal ball amidst this uncertainty, and I recognize
the dangers of retrospective market analysis. I can tell you, however, that I am
old enough to remember the prolonged Vietnam conflict, the subsequent oil price
shocks, and the resulting budget deficits–all contributors to the secular bear
phase from 1966-1982. When I hear of the prospect of continued planning for
conflict in Iraq and witness the current oil price shocks, both of which promise
drags on the budget–and then I see a five-year negative return on the
inflation-adjusted Dow (something that didn’t occur either from 1950-1966 or
1982-2000)–I begin to prioritize the return of my capital alongside the return
on my capital.
Is there a silver lining to be found in any of this? Yes: if you bought the
market from 1950-2003 when the inflation-adjusted Dow was down by more than 4%
on a 150-week basis (N = 408), your annual return rose from 7.22% during the
remainder of the occasions (N = 2244; 1449 up, 795 down) to 13.48% (348 up, 60
down). Such superior returns after weakness also held during the bear period
from 1966 through 1982: When the inflation-adjusted market was down by 7% or
more over 150 weeks (N = 293), the next 50 weeks returned an average of 13.82%
(259 up, 34 down) vs. 2.30% for the sample overall (N = 1028; 585 up, 443 down).
Buying multi-year strength has made investors money only during secular bull
times, but buying multi-year weakness has consistently rewarded investors
willing to take risks.
Brett N. Steenbarger, Ph.D. is Associate Clinical Professor of Psychiatry and
Behavioral Sciences at SUNY Upstate Medical University in Syracuse, NY and
author of The Psychology of Trading (Wiley, 2003). As Director of Trader
Development for Kingstree Trading, LLC in Chicago, he has mentored numerous
professional traders and coordinated a training program for traders. An active
trader of the stock indexes, Brett utilizes statistically-based pattern
recognition for intraday trading. Brett does not offer commercial services to
traders, but maintains an archive of articles and a trading blog at
www.brettsteenbarger.com.
Â