The Odds Favor These Shifts In The Global Economy
We
noted in early January that the global leaders of this global equity bull market
were rolling over. Thailand, China, India,
gold stocks, and key resource equities began to top out. Next, we saw
new highs led by a shift in leadership to lagging sectors such as consumer
staples, Malaysia, Taiwan, Norway, Portugal, and Russia. Tech indexes next
rolled over and the dollar put in a
double-bottom. Then, bonds broke out in response to a much weaker-than-expected
employment report at a time when the employment picture SHOULD be improving
briskly. Now the broad market has rolled over and broken down from triple-top
patterns in most indexes. The leadership on the downside is the overvalued tech
group, semiconductors, and the Naz and Q’s.
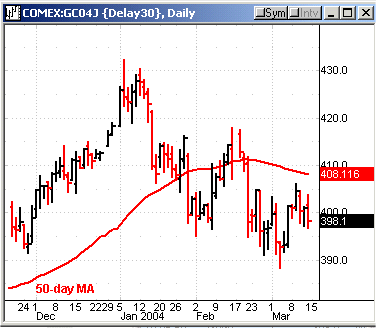
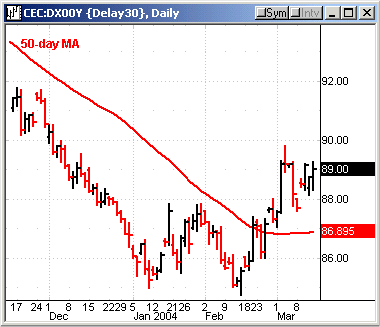
Indexes of business cycle conditions globally are now decelerating with
plurality. It is becoming clear the global growth is shifting from
acceleration to
deceleration. Growth has peaked in the US and in China, the two
primary engines of recovery. Yield curves in Asia have flattened as well,
leading to the conclusion that growth rates in this leading region will not be
as robust for some time to come.
Months ago we wrote about a “typical†bull market correction that corrects
1/3-2/3 of the prior runup occurring sometime after the six-month mark of the
new bull market. Global markets are now reaching their first minor support
levels. If they can bottom within a few percent of current levels and launch
broad-based high volume rallies from here, then new highs are probable in the
near-term But if these levels don’t hold and another higher volume decline in
major global averages develops, the correction
thesis will become much more likely, and we suspect it is already the
most likely outcome here.
If indeed a more prolonged correction develops, as we suspect, investors need to
be on the lookout for signs of whether it will degenerate into a major economic
slump. Investors need to be aware that it is not impossible that the bull
market in global equities is ending. While we don’t believe that this is likely,
it is possible. Massive fiscal and monetary policy stimulus in response to the
bubble popping of 2000 has shielded us from deep recession, but it has also
shielded the world from making the adjustments to massive overcapacity as
well. So far massive liquidity infusion has
fueled a solid turnaround in profit growth, a promising sign. However if
employment doesn’t start picking up soon at least weakly, it will be more
difficult for policy stimulus, which has peaked, to lead to a self-sustaining
recovery in the US in particular.
There are some good reasons to expect that employment
growth will develop in a more muted and slower fashion than normal in
this recovery and that the current deceleration of growth will
NOT develop into recession. Whereas in prior
recoveries, firms that had laid off employees simply re-hired them again as the
economy improved, this kind of job-loss is not nearly as typical in the current
recovery. Most jobs lost in the last recession were permanent. And most jobs
being created now are entirely NEW jobs that
require NEW skills, and not just the re-hiring of
temporarily laid off workers. That kind of job changing requires more time. In
addition, productivity gains in the current environment are
HUGE historically. This means companies are able to
increase productivity INITIALLY through
implementation of new technologies and not by hiring more workers. Productivity
increases have led to a substantially slower level of hiring in this recovery
than any since WWII.
The good news of course is that productivity increases
EVENTUALLY lead to higher employment and wages and lower poverty
rates. The press likes to blame outsourcing of jobs to China and India as the
reason for slow employment gains in this recovery. But employment for exporting
industries has gone up more than employment losses to importing industries
despite our massive trade deficit for many years. Free trade isn’t costing
American jobs, it is simply switching what America focuses on in its global
economic role. These types of job-adjustments are very difficult for people to
make and often require new skills that take time. But the shift of labor to
areas where the US DOES have a competitive
advantage leads to substantial benefits for the US and for the global economy.
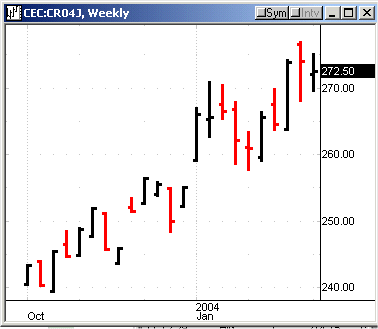
The odds also favor that we are
shifting to a slower growth economy, not a recession.
Capital costs are lower than profit margins with such low interest rates in both
the US and China, and this rarely leads to a no-growth environment. Monetary and
Fiscal policy is still heavily stimulative in most of the world. While the
maximum impact of stimulus is past, the pedal may not be to the floor, but the
accelerator is still clearly on. As long as global stock markets do not drop 10%
very quickly here, the odds still strongly favor a transition to slower global
growth, but growth nonetheless. And that
likely means a correction in global equities, but not a renewed bear market
YET. But investors should realize that global
equity investments are going to be much tougher, much trickier, and much riskier
this year, than they were most of last year. And as soon as it becomes clear
that the global economy is not turning down to a renewed recession, the
transition to an inflationary environment is likely to take place much more
quickly in this recovery than in any since WWII.
And, awash in liquidity, the world is experiencing what would normally be
considered an excess savings problem, where
excessive liquidity needs to be absorbed. The US has taken on the role of
absorbing excess savings, which it has done with massive incentives to consume
and over consume. Without US massive consumption, the global liquidity infusion
would not be leading to global recovery. The Chinese trade balance has also been
falling off tremendously as China develops a strong and broad-based internal
economy, and it is Chinese demand that has fueled the gains in Asia, where China
has a huge trade deficit. However, the big decline in the dollar means that the
US cannot continue to be the only net demander of consumer goods in the world
forever. Its stimulus must be expanded globally and currency and interest rate
markets are working feverishly to force convergence of demand upon other
countries.
As global financial markets adjust to slower growth and to convergence of
demand, the markets are likely to be highly volatile and not make much net
progress. A normal correction in global equities
is very possible during this phase. It is
not impossible that a return to recession could develop, and investors need to
watch things closely to be sure that this is not developing, but this is
currently not the most likely development. Once global adjustments have been
made and growth is more even, we expect reflationary trades to lead the way out
of the current consolidation/correction, but that should be many weeks off.
Traders are advised to be more cautious than usual and to emphasize a more
balanced approach to long/short investing in this climate. We still expect and
advise that nvestors will need to be very attentive and flexible to achieve
decent gains with reasonable risk in 2004, as it looks as though it might be a
volatile year.
So far our US long/short
model is fully on the sidelines and we
continue to suggest investors position in our favorite sectors both long and
short as noted above and use some caution until stocks meeting our criteria
expand in breakout breadth. Investors should continue to cautiously add stock
exposure as trade signals are generated that meet our strict criteria, as well
as allocate to our favorite segments. Our model portfolio followed in
TradingMarkets.com with specific entry/exit/ops levels from 1999 through May of
2003 was up 41% in 1999, 82% in 2000, 16.5% in 2001, 7.58% in 2002, and we
stopped specific recommendations up around 5% in May 2003 (strict following of
our US only methodologies should have had portfolios up 17% for the year 2003) —
all on worst drawdown of under 7%. This did not include our foreign stock
recommendations that had spectacular performance in 2003.
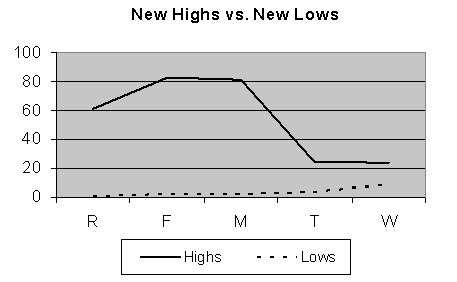
This week in our
Top
RS/EPS New Highs list published on TradingMarkets.com, we had readings of
61, 83, 81, 25, and 24, with 11 breakouts of 4+ week ranges, no valid trades and
no close calls — we’re back into trading range type of readings once again. A
trading range environment is likely until we get stronger internal breadth
numbers and higher quality and quantity of breakouts. Position in valid 4+ week
trading range breakouts on stocks meeting our criteria or in close calls that
are in clearly leading industries, in a diversified fashion. This week, our
Bottom RS/EPS New Lows remained non-existent with readings of 1, 2, 2, 2, 4,
and 9, with one breakdown of a 4+ week range, no valid trades and no close
calls. The short-side breadth remains bleak and it will be important to see if
it picks up here on further corrective activity. We like semiconductor and
broad tech indexes as shorts against longs in our favorite groups.
For those not familiar with our long/short strategies, we suggest you review my
book
The Hedge Fund Edge, my course “The
Science of Trading,”
my video seminar, where I discuss many
new techniques, and my latest educational product, the
interactive training module. Basically,
we have rigorous criteria for potential long stocks that we call “up-fuel,” as
well as rigorous criteria for potential short stocks that we call “down-fuel.”
Each day we review the list of new highs on our “Top RS and EPS New High List”
published on TradingMarkets.com for breakouts of four-week or longer flags, or
of valid cup-and-handles of more than four weeks. Buy trades are taken only on
valid breakouts of stocks that also meet our up-fuel criteria.
Shorts are similarly taken only in stocks meeting our down-fuel criteria that
have valid breakdowns of four-plus-week flags or cup and handles on the
downside. In the US market, continue to only buy or short stocks in leading or
lagging industries according to our group and sub-group new high and low lists.
We continue to buy new long signals and sell short new short signals until our
portfolio is 100% long and 100% short (less aggressive investors stop at 50%
long and 50% short). In early March of 2000, we took half-profits on nearly all
positions and lightened up considerably as a sea of change in the
new-economy/old-economy theme appeared to be upon us. We’ve been effectively
defensive ever since, and did not get to a fully allocated long exposure even
during the 2003 rally.
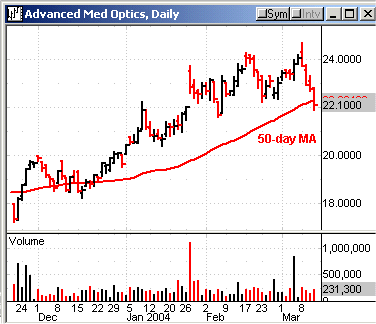
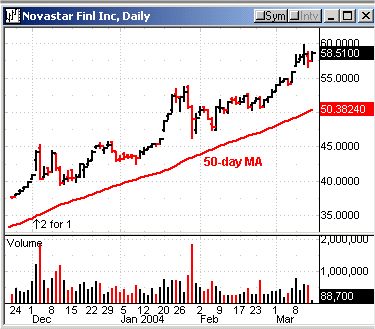
On the long side, we like recent close calls from past weeks:
(
OMM |
Quote |
Chart |
News |
PowerRating),
(
PWN |
Quote |
Chart |
News |
PowerRating),
(
AUO |
Quote |
Chart |
News |
PowerRating),
(
FDG |
Quote |
Chart |
News |
PowerRating),
(
PPC |
Quote |
Chart |
News |
PowerRating),
(
NFI |
Quote |
Chart |
News |
PowerRating),
(
MBT |
Quote |
Chart |
News |
PowerRating), and
(
NIHD |
Quote |
Chart |
News |
PowerRating). We
would keep allocations low until the trend is more certain and emphasize global
leaders noted above until more trade signals are generated and the trend is more
certain.
Mark Boucher
