The Perfect Storm Symmetry
From 1990 to 1997, Kevin Haggerty served as Senior Vice President for Equity Trading at Fidelity Capital Markets, Boston, a division of Fidelity Investments. He was responsible for all U.S. institutional Listed, OTC and Option trading in addition to all major Exchange Floor Executions. For a free trial to Kevin’s Daily Trading Report, please click here.
Commentary for 3/23/11
The previous commentary for 3/14 was the beginning of the Japan crisis, and then the Libya fighting accelerated, so it turned out to be a very volatile week as the SPX went -0.6, -1.1, -2.0, +1.3, and +0.4 on Fri [11/18] as it closed at 1279.20, or -1.9% on the week to 1279.20. The low for the week was 1249.05 on 11/16, and the low weekly close was 1256.88.
The market was already correcting from the SPX 1344 high on 2/18/11 before Japan and Libya, and it made a 123 LT on 3/4 at 1332.28 As I outlined in the Trading Service there was square root symmetry on 3/4/11, which is 1240 CD`s from the 10/1/07 1576 top, and the square root of 1576 is 39.70 [40] and 31 x 40 =1240 CD`s. There was also the 3/6/09 667 bear market low anniversary symmetry. I also outlined in the Trading service the analogy of the 1935-1937 bull market where the cycle was 727 CD`s, and 3/3/11 was 727 CD`s from the 3/6/09 low.
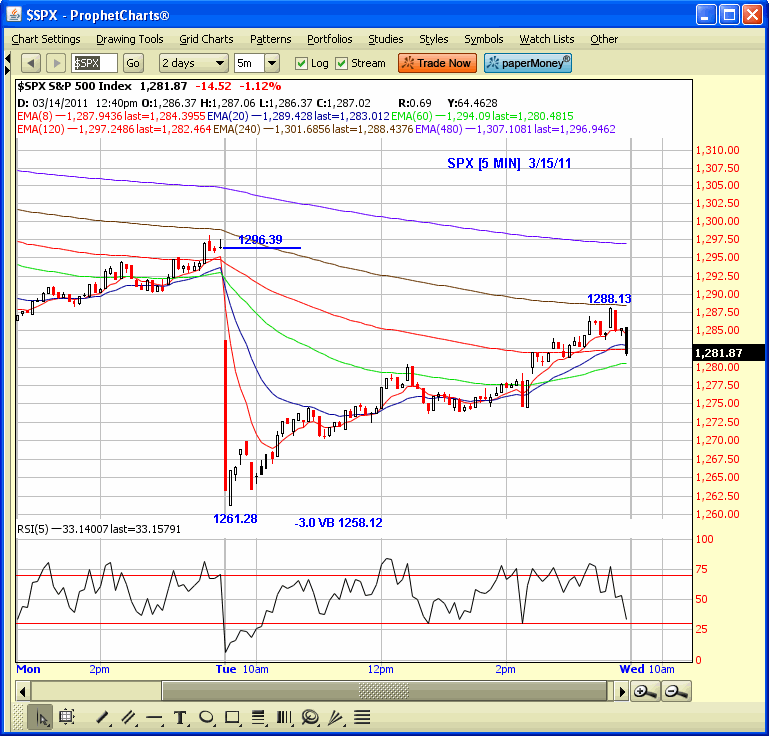
The seasonal probability for a correction in March of at least -5.0% was high, especially since the market was so extended. There was also mid-march symmetry on 3/15/11 which was the .618RT in time of the SPX legs from the 3/6/09 667 low to the 1220 4/26 high, and the leg from the 7/1/10 1011 low to 3/15, which is the .618RT in time. There are 416 CD`s from 3/6/09-4/26/10, and there are 257 CD`s from the 7/1/10 1011 low to 3/15/11 [.618 x 416 = 257] The SPX declined -1.1 on 3/15 and -2.0 on 3/16. It was like a perfect storm as there was a correction in progress in an extended market, key time symmetry, and a crisis accelerated implosion.
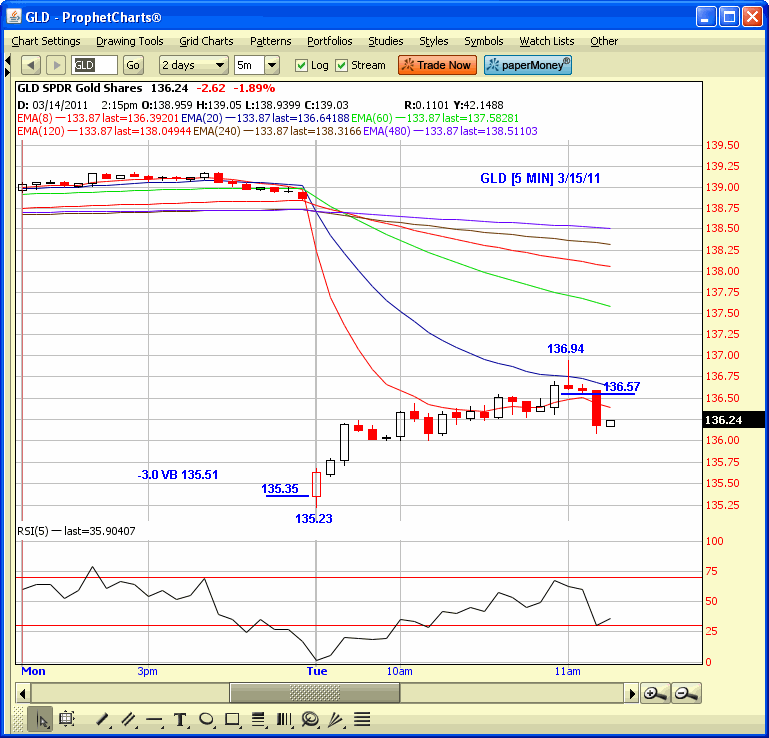
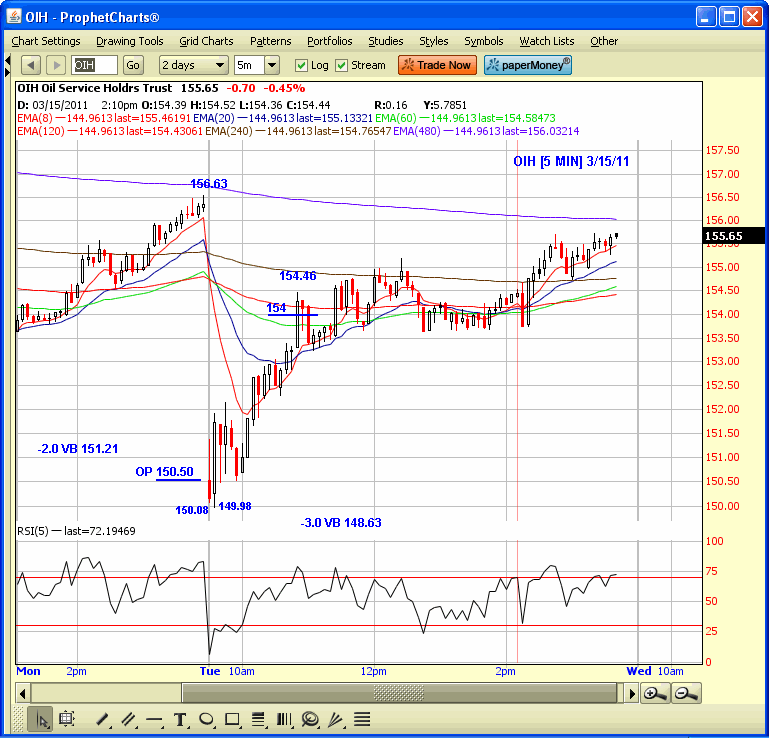
In an email to the trading service before the 3/15/11 NYSE opening, I said to be prepared to play the contra move after openings anywhere from the -2.0 VB to the -3.0 VB zones, so traders in the service had a very profitable day on the panic NYSE opening, accelerated by an inefficient electronic execution system. I have included the 5 min charts for the SPX, GLD, and OIH, but there were obviously many other similar opportunities.
The most significant price zone for buyers is the 1229-1220 zone, which includes the 1228.75 .618RT to 1576 from the 667 3/6/09 low, the 1227.08 11/5/11 high, and the 1220 4/26/10 high which preceded a -17.2% correction to the 7/1/10 1011 low. The 200DEMA is 1216, so the zone has strong symmetry. A correction to the zone is about a 10% correction which the SPX hasn`t had since the -17.2% decline from 1220-1011 in 2010.
I expect the SPX to at least test the recent 1249 low, but if does and it holds, then then a reversal above 1300.58, which is the 3/21 swing point high, with the 20DEMA now at 1298, is a good entry point for position traders. If it doesn`t hold the 1249 low, then investors and traders who want to increase their equity allocations should do it on a scale in basis starting a few points above the 1229 zone high.
Have a good trading day!


Click here to find full details on Kevin’s courses including Trading with the Generals with over 20 hours of professional market strategies. And for a free trial to Kevin’s daily trading service, click here.
