The QQQQ rally is only starting, here’s why
High RSI Says QQQQ Rally Just
Starting!
Many traders may be tempted to look at the RSI of 70 on QQQQ
and determine that the stock (and thus the Nasdaq-100) is overbought and due for
a pullback after the big rally we’ve seen. But what is important in reading an
indicator like RSI is NOT the actual value that it is reading, but how the stock
has reacted in similar situations in the past.
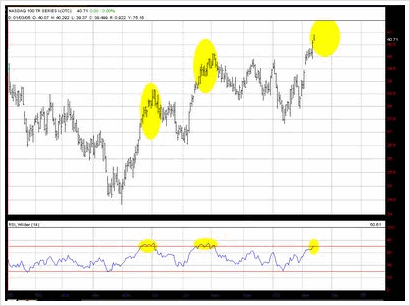
Let’s take a look at the year-to-date chart of
(
QQQQ |
Quote |
Chart |
News |
PowerRating):

Notice how in 2005 there have been two other times when the
RSI hit the 70 level, both naturally coming after significant runs higher in the
stock.
On the first occasion, in the middle of May, the RSI hit 70 as
QQQQ hit 37.50. Was this a top for that cycle? No. The Q’s ran over a dollar
higher over the next two weeks before topping out, with the RSI holding above 70
the entire time.
The second instance took place in late June, with QQQQ hitting
38.65 as the RSI crossed 70. Again, this was not a top. The stock ran another
1.50 higher before topping out at 40.12–again about two weeks later.
Bet on History Repeating Itself:
Well, here we are again. A big run to new highs and the RSI
hitting 70. As we’ve seen by looking back at the chart, the only other two times
this has happened this year the Q’s have seen an extension of the rally over the
following two weeks by an average of about 4.2%.
When history repeats itself (as it tends to do), we’ll have a
nice continuation of this move through the end of November and up to 42-42.25 on
QQQQ before we finally top out.
Andy Swan
created and co-founded DaytradeTeam.com five years ago on a principle of
empowering individual stock and options traders with the techniques and analysis
methods typically reserved for elite professionals. His expertise in technical
analysis and commitment to educating members earned DaytradeTeam a top-ranking
among advisory services for several years.
