The SMH is setting up nicely
Stocks began the day in marginally
negative territory, oscillated in a narrow, sideways range throughout
the session, then recovered to finish flat to higher. Both the S&P 500 and Dow
Jones Industrials were unchanged, while the Nasdaq Composite gained less than
0.1%. The small-cap Russell 2000 and mid-cap S&P 400 indices continued their
perfect records in 2006, gaining 0.7% and 0.3% respectively. Both the Russell
and S&P 400 are trading at all-time highs, so the complete lack of overhead
supply means only minimal buying pressure is needed in order to lift those
indices higher. The relative strength of the Russell and S&P 400 over the past
several days is a good example of how stocks, ETFs, and indexes at new highs
typically continue to cruise higher.
Total volume in the NYSE increased by 5% yesterday, while
volume in the Nasdaq was on par with the previous day’s level. Given that the
S&P was unchanged, a decline in volume would have been more bullish. When
turnover rises and prices do not correspondingly gain, it often indicates
“churning” activity that is indicative of institutions selling into strength.
However, volume only rose by a small amount in the NYSE and was unchanged in the
Nasdaq. Overall, one could infer that yesterday’s relationship between price and
volume leaned to the bearish side, but not enough to rouse any major red flags.
On the contrary, a minor price correction would be welcome.
As we approach the middle of January, the broad market to
continues to act great. Both the Russell and S&P 400 are at record highs, while
the S&P 500, Dow Jones, and Nasdaq Composite are at four-year highs. With a lack
of overhead supply, it is pointless to discuss where the major resistance levels
are. Quite simply, there aren’t any! Instead, let’s look at where one could
expect the major indices to find short-term price support in the event of a
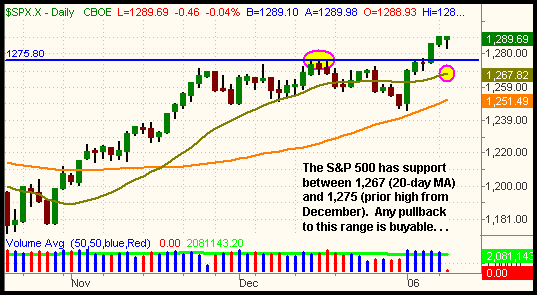
correction. First, take a look at the S&P 500 daily chart:

As the chart above illustrates, the S&P has key support
between the range of 1,267 (the 20-day moving average) and 1,275 (prior high
from December). Below that, the 50-day moving average (the orange line) should
provide major support at the 1,251 area. If looking for a low-risk entry point
in SPY or other new long positions in the broad market, a price retracement into
the range of 1,267 to 1,275 would be ideal. Alternatively, a sideways
“correction by time” of three to five days would also enable the 20-day moving
average to rise up and provide support as well. Of the two, a “correction by
time” would be more bullish because it would indicate sellers are few and far
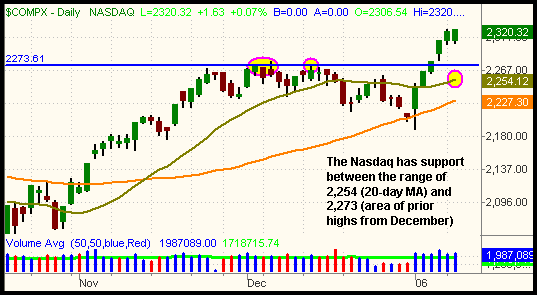
between, even when the bulls are taking a break. Next, let’s analyze the Nasdaq
Composite’s short-term support levels:

Similar to the S&P 500, the Nasdaq should first find support
in the area of its prior highs from December (2,271 to 2,278). Below that, the
20-day MA, presently at 2,254, will provide secondary price support. The 50-day
MA rests further down at 2,227. Again, any retracement into those support levels
would provide ideal entry points for Nasdaq-related stocks or ETFs.
Specifically, consider buying
(
SMH |
Quote |
Chart |
News |
PowerRating) (Semiconductor HOLDR) or individual
semiconductor stocks if the Nasdaq corrects in an orderly fashion down to the
range of 2,254 to 2,278.
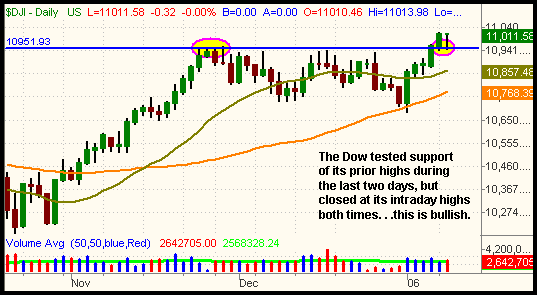
The Dow Jones Industrial Average is less extended than the S&P
and Nasdaq, as it just broke out to a new four-year high three days ago. The
intraday lows of the past two days correlate to support of the prior highs in
the Dow, which is why we bought a new long position in
(
DIA |
Quote |
Chart |
News |
PowerRating) (Dow Jones
Tracking Stock) on January 9:

Obviously, there are several industry sectors we are stalking
for potential entry on a price correction as well. Here are the sector ETFs we
like the most for long entry on any retracement down to support:
(
GLD |
Quote |
Chart |
News |
PowerRating) (Gold
Trust),
(
FXI |
Quote |
Chart |
News |
PowerRating) (China Xinhua 25),
(
SMH |
Quote |
Chart |
News |
PowerRating) (Semiconductors), and
(
SWH |
Quote |
Chart |
News |
PowerRating)
(Software). We also like
(
HHH |
Quote |
Chart |
News |
PowerRating) (Internet) if it breaks out of consolidation
on its weekly chart. We presently remain long
(
PPH |
Quote |
Chart |
News |
PowerRating) (Pharmaceuticals) and
(
DIA |
Quote |
Chart |
News |
PowerRating)
(Dow Jones Industrials), both of which are acting well. As always, regular
subscribers will be alerted of any changes to stops in these positions, as well
as new entries in any of the ETFs above.
Open ETF positions:
Long
(
PPH |
Quote |
Chart |
News |
PowerRating), long
(
DIA |
Quote |
Chart |
News |
PowerRating) (regular subscribers to
The Wagner Daily receive detailed stop and target prices on open
positions and detailed setup information on new ETF trade entry prices. Intraday
e-mail alerts are also sent as needed.)
Deron Wagner is the head trader of Morpheus Capital Hedge Fund
and founder of Morpheus Trading Group (morpheustrading.com),
which he launched in 2001. Wagner appears on his best-selling video, Sector
Trading Strategies (Marketplace Books, June 2002), and is co-author of both The
Long-Term Day Trader (Career Press, April 2000) and The After-Hours Trader
(McGraw Hill, August 2000). Past television appearances include CNBC, ABC, and
Yahoo! FinanceVision. He is also a frequent guest speaker at various trading and
financial conferences around the world. For a free trial to the full version of
The Wagner Daily or to learn about Deron’s other services, visit
morpheustrading.com or send an e-mail to
deron@morpheustrading.com .
