The Strongest Intraday Patterns Are Found Here…
They
turned the hourglass upside down yesterday,
as the Dow
(
$INDU |
Quote |
Chart |
News |
PowerRating) ended +2.1%, SPX
(
$SPX.X |
Quote |
Chart |
News |
PowerRating) +1.9%, Nasdaq
(
$COMPQ |
Quote |
Chart |
News |
PowerRating) +2.7%, and NDX
(
$NDX.X |
Quote |
Chart |
News |
PowerRating)
+3.2%. NYSE volume held at 1.5 billion, with the volume ratio at 85, and breadth
very strong at +1350. All of the major sectors gained, including the retail, as
the RLX was up 3.5%. Some of the major sectors are pushing new five- to
six-month highs, like the BKX which is in an 800 – 740 box and closed yesterday
at 791.40. The XBD’s high close since June is 459.75 and closed yesterday at
450.48.
On the daily charts, the
(
SPY |
Quote |
Chart |
News |
PowerRating)s and
(
DIA |
Quote |
Chart |
News |
PowerRating)s are in a four-day range, with the last three days’
bars all within the Jan. 6 wide-range bar up. The
(
QQQ |
Quote |
Chart |
News |
PowerRating)s are in an opposite
double-bar inside pattern with upside breakout above 27. The .707 retracement is
27.47 and .786 is 27.82. The Dow made a new rally high close yesterday at 8776
with the .786 retracement just above at 8872. Yesterday’s up move puts the SPYs
in a 1,2,3 close possible short setup on the daily chart with potential short
entry below 91.41. New highs today negates that pattern.
As you must know by now,
I always use the 60-minute charts in preparing my trading plan because the
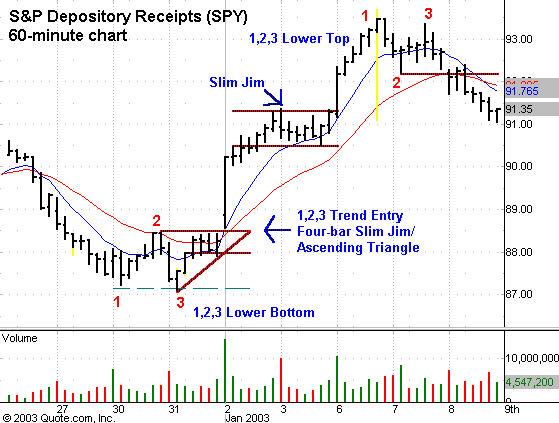
strongest intraday patterns are found there. For example, I have included a
60-minute chart of the SPYs in today’s text which covers the movement from the
87.11 low of this current rally. The entry patterns are very clearly defined as
you will see, and the specifics of those strategies are all included in the
1,2,3 and
Slim Jim modules.
The chart shows you a
1,2,3 lower bottom with first entry above 87.42, then trend entry above 88.47,
which was also a Slim Jim and Triangle breakout. The next entry was the nine-bar
closing-range Slim Jim you were alerted to with entry above 91.34. After hitting
93.70, there was a 1,2,3 lower top with trend entry below 92.20 as it traded
down to 91.05.
I have often suggested
that new or novice traders start with the 60-minute chart and just stay there,
trade less, but you’ll get a lot of confidence because it’s a much higher
probability on your trade. The things I do are simple, defined and cross all
markets and time frames. You shouldn’t get too involved looking for things that
aren’t there. Believe it and trade it.
Looking at the 60-minute
chart for the SPY today, I see a six-bar closing Slim Jim just below the most
recent swing point high of 93.70. The Slim Jim range is 93.00 – 92.50, so that
is my initial trading reference for today. The SMHs also have a defined Gap and
Pullback pattern with the last bar’s close in the top of the range. The 1,2,3
lower top entry doesn’t get activated until it trades below 24.26. The first
long entry is above 25.03. Having done this for the major indices and sectors, I
can just relax and watch the action approaching my reference points and decide
whether to take entry or not.
Next week is a strong
time period, as I have mentioned, and after this rally, I am prepared for the
short side, but only if I get the reversal pattern. That starts for me on the
60-minute chart. If I take a short entry in the index proxies and they finish
with some cushion gain on the day, they will get carried overnight. The market
is in a retracement zone that can quickly become a continuation move, and it is
also entering a strong time period, so there will be a decisive movement from
these levels very soon.
Have a good trading day.

Â

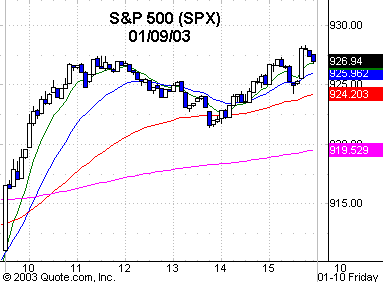
Five-minute chart of
Tuesday’s SPX with 8-, 20-,
60- and 260-period
EMAs

Five-minute chart of
Tuesday’s NYSE TICKS
