The Ultimate Driver Is Emotion
Friday
was an excellent trend up day for daytraders,
provided you trade reversal strategies
from high-probability zones. On the day, NYSE volume was 1.48 billion, a volume
ratio of 74, and breadth +1318, which was a nice rebound off of the .618 levels
for both the SPX
(
$SPX.X |
Quote |
Chart |
News |
PowerRating) and Dow
(
$INDU |
Quote |
Chart |
News |
PowerRating). The SPX and Dow both
gained about 1.3%, while the Nasdaq
(
$COMPQ |
Quote |
Chart |
News |
PowerRating) was -0.1%. The Mid-Cap index
gained 1.5% and the Russell 2000 +1.2%, so it was more than just a few S&P
programs that participated.
The early gap down was
precipitated by the media hype of the
(
AMAT |
Quote |
Chart |
News |
PowerRating) news, which lasted all of one
bar for the
(
SMH |
Quote |
Chart |
News |
PowerRating)s. The previous close was 21.66. The SMHs opened down 4.1%,
hit a 20.45 intraday low on the first bar, but by the fourth bar, it was trend
up from there. The .786 retracement level to the October low was 20.25, so you
were involved in the action right away, or else you took the 1,2,3 higher bottom
pattern with entry above the signal bar high of 20.78. Entry was on the 10:40
a.m. bar. The SMHs traded up to 21.73, closing at 21.50. We are thanking you,
CNBC, for the major assist that enabled the specialists to gap it down and
provide us a windfall.
The SPX and Dow were
easy, as they both bounced off their .618 retracement levels to the October lows
and gave us an excellent intraday pop. The SPX hit an intraday low of 840.34 on
the second bar and immediately took off from there on the third bar. The exact
.618 number is 839.55. The 840 number was also an extended three-month standard
deviation band on Friday, in addition to 839.69 being the 1.27 Fib extension of
the last major leg up on your intraday charts.
Feb. 3 is a 1.618 time
date between the Aug. 22 and Dec. 12 top, so you are always alert for action
around these dates. 841 is also a primary Square of Nine number. Friday was the
13th day down from the last rally high of 935.05.
Net net, there was a lot
going on around the .618 level, and you were on alert, as I gave you the chart
last week. The initial run from 840.34 was to an 852.37 high by 10:00 a.m.,
before pulling back to a signal bar low of 843.38. A 1,2,3 higher bottom entry
was above the high of that bar, which was 844.42. That carried up to the
intraday high of 858.33 and closing at 855.38. This exercise points out that
with just the
1,2,3 module, you would have taken an excellent 1,2,3 higher bottom trade,
but understanding sequence made it a much higher probability trade.
The Dow made the same
1,2,3 higher bottom move, with the intraday low at 7917 vs. the .618 number of
7908. Entry was above 7965 with the trade running to an 8090 intraday high,
closing at 8051.75. If you trade the Nasdaq futures or
(
QQQ |
Quote |
Chart |
News |
PowerRating)s, you also got
the 1,2,3 higher bottom trade, the point being it doesn’t matter what major
index you trade.
If we get a Feb. 3
continuation of Friday’s reflex rally, then you must be aware of the immediate
overhead resistance. For the SPX, that is the .50 retracement at 861.45 and the
870 head-and-shoulder neckline. For the SMHs, the neckline is about 23, and for
the Dow, it is 8240 – 8245. The QQQs closed at 24.44, which is above the 24.28
neckline and is also the Dec. 31 low.
Something you must always
remember as a trader is that the ultimate driver of valuation levels is human
emotion and that is in full sway right now. We have Secretary of State Powell at
the United Nations on Wednesday, and then the futures traders’ favorite on this
first Friday of the month, which are the jobs and employment numbers. We will
have opportunity this week both ways.
Have a good trading day.

Five-minute chart of
Friday’s SPX with 8-, 20-,
60- and 260-period
EMAs

Five-minute chart of
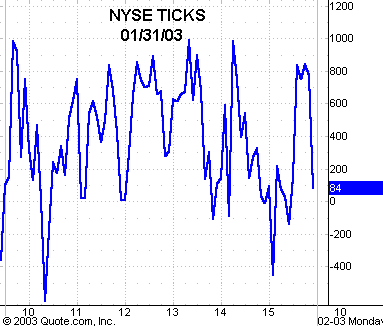
Friday’s NYSE TICKS
