There is nothing to indicate the selling is finished
The S&P 500’s break of its 200-day
moving average triggered a sharp selloff yesterday, causing a lot of
technical damage to the charts of the major indices. Stocks fell swiftly in the
first thirty minutes of the session, but attempted to reverse in the late
morning. By mid-day, each of the major indices had rallied back up to their
morning highs, but traders sold into strength, resulting in another wave down in
the afternoon. By the closing bell, each of the indices had dropped to and
finished at new intraday lows. The S&P 500 and Dow Jones Industrial Average lost
1.3% and 1.5% respectively, while the Nasdaq Composite plummeted 1.7% to its
lowest closing price since October of 2005. The S&P Midcap 400 Index also
declined 1.7%, but the small-cap Russell 2000 fared even worse with its 2.0%
loss.
Although turnover declined when stocks sold off in the
previous session, institutional selling returned to the scene yesterday. Total
volume in the NYSE spiked 20% higher, while volume in the Nasdaq was 12% higher
than the previous day’s level. The losses on higher volume caused another
“distribution day” to register for both the S&P and Nasdaq. Since the month
began, the Nasdaq has closed lower in five out of eight sessions. Volume was
higher in three of those five “down” days, but higher in only one of the three
“up” days. This negative pattern of the broad market’s price to volume ratio
shows that institutions are continuing to dump shares into any strength. Firmly
bearish market internals confirmed yesterday’s price action. In both exchanges,
declining volume exceeded advancing volume by more than 7 to 1.
Since we have focused primarily on specific industry sectors
over the past several days, let’s take an updated look at the charts of the
major indices. Yesterday’s action caused all the broad-based indices to break
some sort of key support level, but the Nasdaq Composite suffered the most
significant technical damage. Remember when we mentioned a few days ago that the
performance of the Semiconductor Index ($SOX) usually leads the performance of
the Nasdaq overall? Specifically, when the $SOX fell below its prior low from
June 14, we felt it was an ominous sign for stocks overall because the Nasdaq
tends to follow the direction of the heavily-weighted $SOX index. If you paid
attention to that breakdown to a new low in the $SOX, you therefore should not
have been surprised that the Nasdaq followed suit to a new low yesterday as
well:

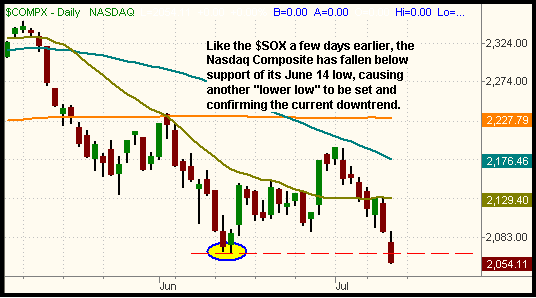
The Nasdaq’s close below the June 14 low of 2,065 caused the
index to set a new nine-month low. As such, the rally that took place from the
middle of June through the beginning of July is now completely dead. More
importantly, the Nasdaq has set another “lower low” to match the “lower high”
that was set in July 3. The downtrend that began at the beginning of May is
still in full effect. Furthermore, a lot of overhead supply has been left in the
wake of the Nasdaq’s drop to a new low, so expect any subsequent rally attempt
to be met with resistance of further selling into strength.
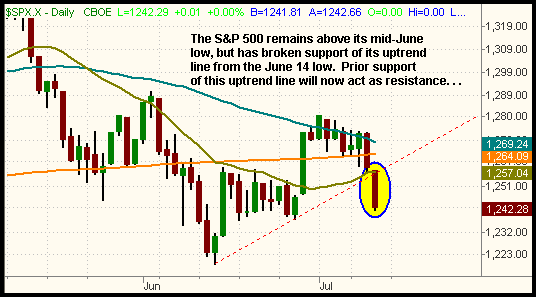
Of the major indices, the Nasdaq is the only one that has
already broken support of its June low, but the other indices are catching up as
well. The Dow closed back below its 200-day moving average yesterday, a bearish
sign for the direction of its long-term trend. The S&P 500 slid further below
its 200-day moving average that it broke below on Wednesday. Equally notable is
that yesterday’s loss caused the S&P to fall below support of its uptrend line
from the mid-June low. Take a look:

If you check out the daily charts of the Dow Jones
Industrials, Russell 2000, and S&P Midcap 400, you will notice that each index
broke support of its uptrend line from the June lows as well. This bodes well
for our short position in the S&P Midcap SPDR (MDY), as our downside price
target is support of its June low. We still expect MDY to test that low in the
near future, but we covered one-third of the position yesterday to lock in a
gain of nearly four points on partial share size. We will continue trailing a
stop lower on the remaining shares in order to maximize profit while locking in
gains.
Our reversion back to a negative short-term bias has certainly
been confirmed by the price action of the past several days. Our bearish
intermediate-term bias that we assumed in late May never changed, despite the
late June bounce. There will occasionally be upside retracements, sometimes fast
and furious, within the context of the current downtrend, but there is nothing
to indicate the selling is finished or that stocks have found a market bottom.
It is crucial that you are vigilant with regard to cutting losses on any long
positions that fall more than 7 or 8% below your entry price. Failure to stick
with a plan of protective stops could easily result in the rapid disappearance
of your trading capital when downside momentum is so strong. Live to trade
another day by maintaining discipline to cut your losses. Better yet, follow the
trend of the market and profit instead.
Open ETF positions:
Short
(
MDY |
Quote |
Chart |
News |
PowerRating) (regular subscribers to
The Wagner Daily receive detailed stop and target prices on open
positions and detailed setup information on new ETF trade entry prices. Intraday
e-mail alerts are also sent as needed.)
Deron Wagner is the head trader of
Morpheus Capital Hedge Fund and founder of Morpheus Trading Group (morpheustrading.com),
which he launched in 2001. Wagner appears on his best-selling video, Sector
Trading Strategies (Marketplace Books, June 2002), and is co-author of both The
Long-Term Day Trader (Career Press, April 2000) and The After-Hours Trader
(McGraw Hill, August 2000). Past television appearances include CNBC, ABC, and
Yahoo! FinanceVision. He is also a frequent guest speaker at various trading and
financial conferences around the world. For a free trial to the full version of
The Wagner Daily or to learn about Deron’s other services, visit
morpheustrading.com
or send an e-mail to
deron@morpheustrading.com .
