These 2 Charts Are The Most Extended
What Friday’s Action Tells
You
It was a -2.4% four-day week for the SPX
(
$SPX.X |
Quote |
Chart |
News |
PowerRating)
from Monday’s 1195.98 to Friday’s 1167.82 close, -0.7% on the day. The Dow
(
$INDU |
Quote |
Chart |
News |
PowerRating)
was also -0.7% on Friday to 10,393, the Nasdaq
(
$COMPQ |
Quote |
Chart |
News |
PowerRating) 2034, -0.6%,
and
the
(
QQQQ |
Quote |
Chart |
News |
PowerRating) 37.05, -0.8%. NYSE volume was 1.66 billion shares with the
volume ratio 35 and breadth surprisingly neutral at -145.
Year to date, the SPX is -3.8% on a closing
basis
with the past four days being -2.4% of it. The downside action accelerated
in
the last hour on Wednesday and Thursday and did the same from 1:30 p.m. ET
into
the close on Friday. The sectors were all red on Friday, led by the
(
SMH |
Quote |
Chart |
News |
PowerRating),
-1.4%, and RTH, -1.1%, with the lone exception being the XAU,
+2.1%.
All of the major index intraday trends are
knife
down with the longest one, which is the “523 Trend Method“
(120-minute chart),
having the SPX closing at 1167.82 with the 34 EMA up at 1183.47.
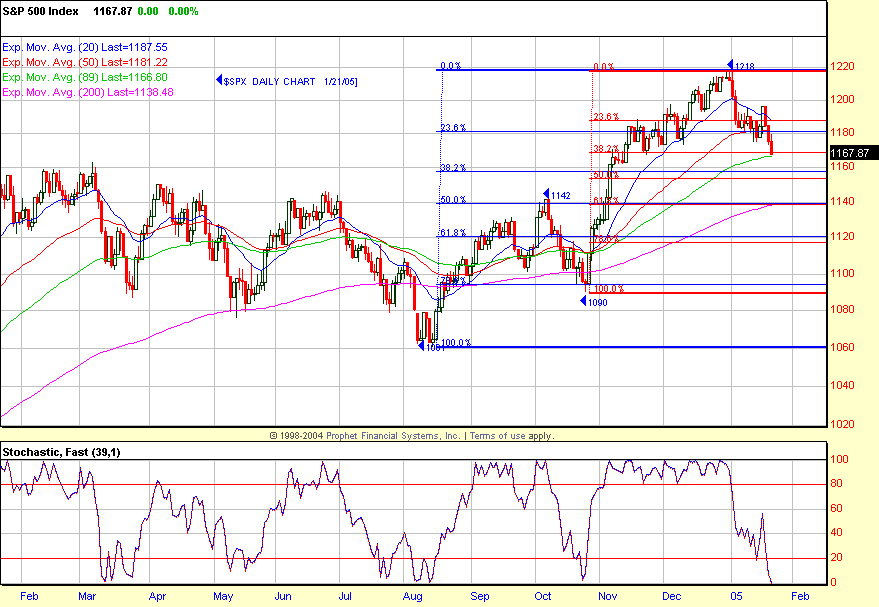
During the SPX +14.8% rally from the 1061
August
low to the 1218 high, there was just one retracement of -4.5% from 1142 –
1090.
>From 1090 (10/25 low), the SPX advanced +11.7% with no retracement
whatsoever,
so there is nothing abnormal about the current percentage retracement so
far,
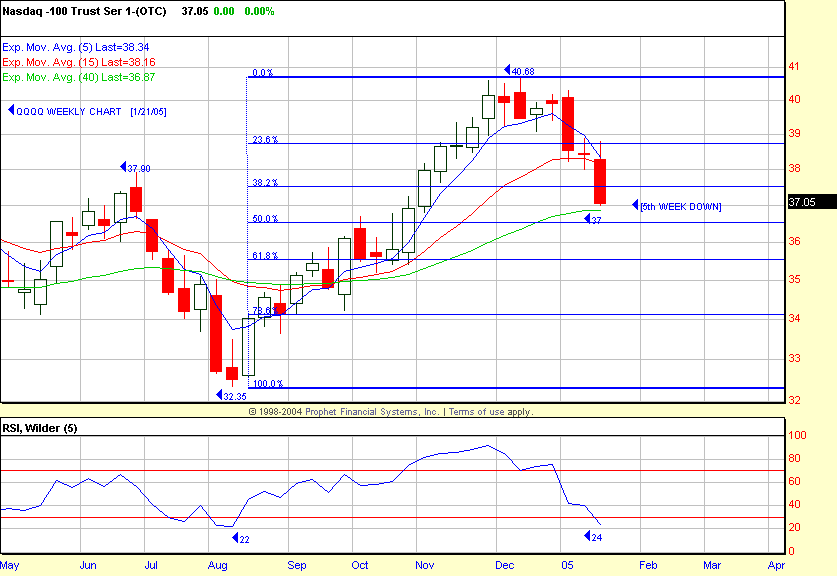
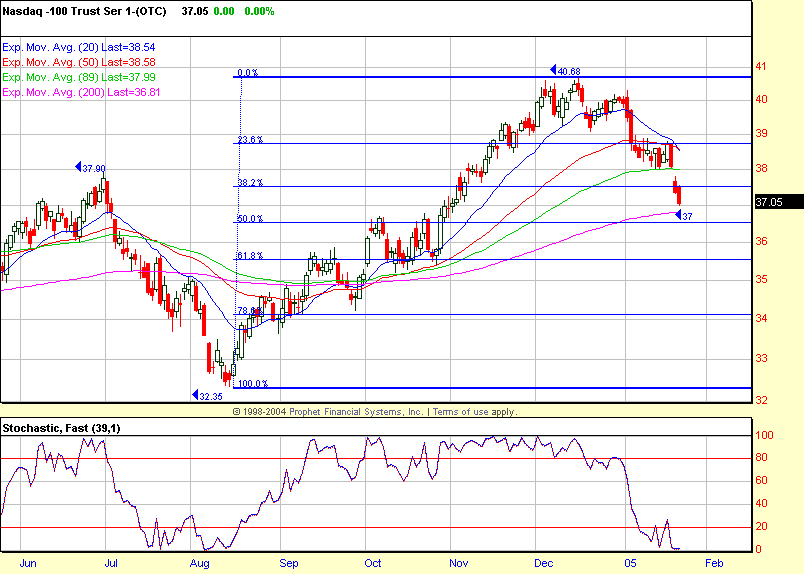
except that it is occurring starting the new year. The QQQQ is at the more
important price zone having closed at 37.05 with the 40-week EMA at 36.87
and
200-day EMA at 36.80. The .50 retracement to the August 32.35 low is about
36.50. If the Generals are to get involved, it will be in this current price
zone.
The SPX is at the .382 retracement zone to
the
1090 low and also the 89-day EMA, now 1166.80, so it is a live price zone
and is
as oversold as the August and October lows. I have included the SPX daily
chart
with the different price zones outlined, and as you can see, it has the .382
retracement to the August low in confluence with the .50 retracement to the
October 1090 low just below 1160, not to mention the more important 1161 .50
retracement to 1553 from 769. Even with the sharp price decline, the SPX
20-day
EMA > 50-day EMA > 200-day EMA.
Those of you who work with the
Primary Tools
and
Core Framework see that the QQQQ and SMH are the most extended on the
three-month chart and down to the -2.0 bands. The
(
SPY |
Quote |
Chart |
News |
PowerRating) and
(
DIA |
Quote |
Chart |
News |
PowerRating)
are at
about the -1.5 bands. Looking at shorter timeframes, you see that the SPX is
now
just below the -2.0 band with the -3.0 band at 1160, so this is more
confirmation of an important zone.
There is too much emphasis on small moves in
the
major indices on a daily basis that influence traders/investors to take or
abandon longer-term positions. I look at the current level of the SPX and
see a
-2.5% higher-probability buy zone from current levels and as a retracement
in a
longer-term uptrend above rising moving averages until proven otherwise. We
have
caught all of the retracements so far, and at worst case, expect to catch at
least one more before the cycle is over. Worst case would be a
1,2,3 Lower
Top
to 1218, but I think the fifth leg of this cycle will go higher, and if it
doesn’t, then you will get taken out with your trailing stops. Last year
there
were just four good retracement buy opportunities as the fourth leg of this
cycle
unfolded, and this is the first retracement of 2005. Should this retracement
exceed that -2.5% zone from current levels, then a 1,2,3 Lower Top to 1218
would
become the higher probability.Â
Have a good trading day,
Kevin Haggerty


