These 2 Charts Tell You What To Watch Today
Monday’s session was one of pure price
inaction. Stock index markets flopped sideways as the Dow finished slightly
green while Nasdaq closed slightly red. Just another one of the non-event days
that mark time between normal to large-range days sprinkled in, here & there.
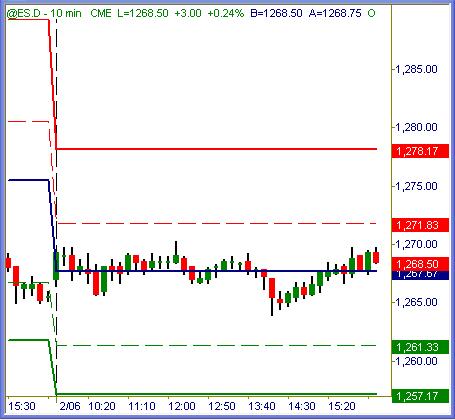
ES (+$50 per index point)
S&P 500 futures pretty much rode the daily
pivot point value in total sideways fashion. Not much to be done with this one
of real consequence. With a total session range of 6.25 points from tip to turn,
it measured far below a normal range day.
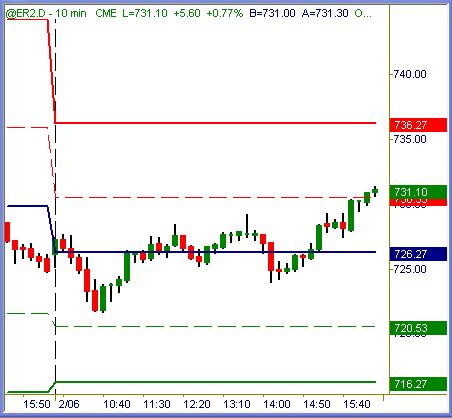
ER
(+$100 per index point)
Russell 2000 futures made some small swings in
gyrational fashion, most of the moves coming from surge candles higher or lower.
It was possible to scalp out modest gains at best, breakeven performance at
worst while using the right technique.
Summation
Daily chart measures remain intact from Monday’s post following inside day
sessions. Indexes remain quiet as they either work off grossly overbought
conditions in sideways fashion or jostle around for further downside backing &
filling below. Not a soul on earth knows which way that will be, predictions are
glorified guesswork at best. Right now we see major indexes showing signs of
weakness except for the Russell 2000, S&P 400 and Dow Transports. Sooner than
later all sectors will move in unison, and they’ll move lockstep for awhile.
Until then, sideways churn thru this period of consolidation continues. Day
trader’s market conditions prevail, swing traders wait patiently for the next
directional break to come.
Trade To Win
Austin P
(Online video clip
tutorials…
open access)
Austin Passamonte is a full-time
professional trader who specializes in E-mini stock index futures, equity
options and commodity markets.
Mr. Passamonte’s trading approach uses proprietary chart patterns found on an
intraday basis. Austin trades privately in the Finger Lakes region of New York.