These 4 indexes are all bullish
Friday’s session was a typical drifty,
go-nowhere type of equity option expiry events. The four-day week ahead is
filled with potential market-moving events, starting with the release of FOMC
minutes this afternoon. Could be the deciding week for stock index markets to
break down and retrace or above recent highs for clear sailing into early
spring.
SPX
S&P 500 cash index
did have a weekly span upwards of nearly +30pts total. That said, look where the
lows and highs are… no different than witnessed since early November. Until
the current highs and lows of this pattern are exceeded on a weekly closing
basis, no trend bias exists. Once that break & close happens, expect a
significant directional move to follow.

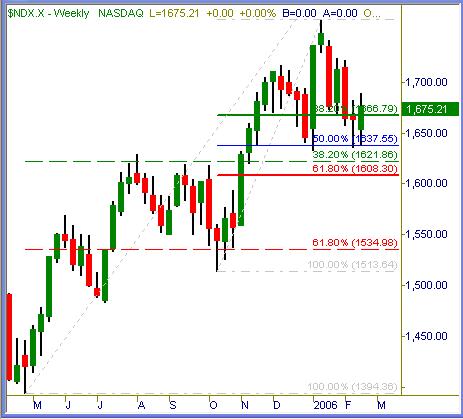
NDX
Nasdaq 100 Matched last week’s “doji” candle of indecision with a somewhat
bullish candle within a similar price span. Techs are trading weaker than
old economy stocks… held back by
(
GOOG |
Quote |
Chart |
News |
PowerRating),
(
DELL |
Quote |
Chart |
News |
PowerRating) and a host of other
stalwarts. Whichever way techs lead next is probably how the broad market
will follow suit.
INDU
Dow Industrials staged
a breakout week… finally closing outside the three-month sideways range.
Had the S&P 500 and/or Nasdaq 100 matched movement, we could view this as
a broad market ascent. Until those other big indexes follow suit, looks
like a Dow specific rally for now.
Dow Transports also
posted new all-time highs again, which confirms / was confirmed by the
breakout in Dow Industrials. Most of this action is likely attributed to
what Fed Governor Bernanke had to say & did not say in his testimony on
Capital Hill. The assertion that U.S. economy is viewed as healthy &
robust naturally translates to the Dow components. Again, spillover into
the S&Ps and especially techs will confirm the stale range breakout is
finally headed higher.

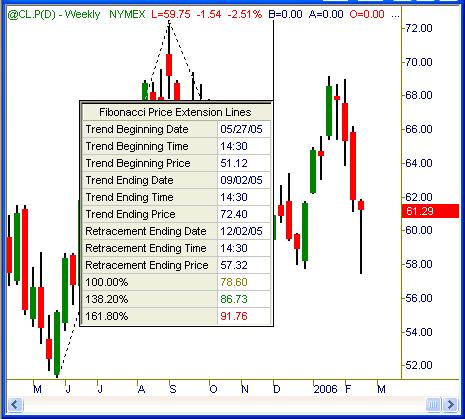
CL
Black Gold: crude oil
prices have been on a tempestuous ride for the past calendar year. Some
huge swings both directions ranged from $50s to $70s per barrel. If we
step back and measure the most dominant low-high-low from May 05 – Sep 05
– Dec 05, that projection shows initial upside target of $78 per barrel
with a lofty $92 per barrel not out of the question.
Last week’s very
bullish hammer candle popped $4,000 per contract off the lows to the
close… and might be the next relevant lows before $78 per barrel prints
this tape.
Summation
Trend view is one of almost upside breakouts. Dow
Industrials & Transports, Small Caps and Mid Caps are all 100% bullish
right now. The remaining indexes – sectors are either stalled in neutral
or (some not shown) bearish alignment. Next week gets us past the Feb
option expiry events of last week as we head towards the end-month period
of traditional bullishness. Should be a prime time to see definitive
action in the markets.
Upside trend (if confirmed) could continue much further ahead than stubborn shorts
would ever imagine. Downside push eyes the current 2006 lows as next
target of support before longer term layers below come into play.
Trade To Win
Austin P
(Full trend
view report…
open access)
Austin Passamonte is a full-time
professional trader who specializes in E-mini stock index futures, equity
options and commodity markets.
Mr. Passamonte’s trading approach uses proprietary chart patterns found on an
intraday basis. Austin trades privately in the Finger Lakes region of New York.