These 6 Volume Rules Help You Determine The Direction Of The Market
Stock
index futures opened Thursday’s session lower again mainly due to a continued
shift in sentiment after a few reports of negative guidance from the Retail
sector. The futures spent the first hour chopping higher to fill the gap,
further buoyed by July Leading Indicators not showing any hint of inflation.
Attention deficit disorder pretty much set in, which is pretty typical with this
week’s options expiry. Also, I’m sure the inability of the equity markets to
make any real ground on the heels of weaker crude oil kept some market
participants at bay. Breadth, which started out weak and tried to rally, spent
the last few hours participating in the choppy theme.
The
September SP 500 futures finished Thursday’s session at the flat line again, while the Dow futures showed a little bit better resilience
again with a gain of +6 points. Looking at the daily charts, the ES and YM
both posted dojis again, with the ES settling below its 50-day MA. On an
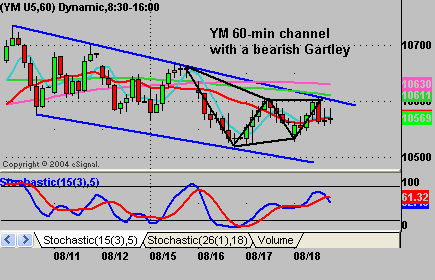
intraday basis, 60-min channels continue to define the daily ranges. For you daily 3-Line Break
followers, the ES remains short with a new Break Price of 1229.75, while the YM
remains short with a Break Price of 10627.

Friday is
free of economic reports and will also probably be free of any real bias. It’s
also options expiry, so it will probably be a good day to start the weekend
early.
Listen to What Volume Tells You!
There are 6 simple rules to learn in order to
interpret price and volume movements:
1. Increasing volume on
increasing price signals an acceleration in buying pressure and price advance.
2. Increasing volume on decreasing price signals
an acceleration in selling pressure and price decrease.
3. Decreasing volume on increasing price
indicates an easing in buying pressure and a leveling in price or price
reversal.
4. Decreasing volume on decreasing price
indicates an easing in selling pressure and a leveling in price or price
reversal.
5. Higher than normal volume at price highs
indicates selling into strength and a price ceiling.
6. Higher than normal volume at price lows
indicates buying on weakness and price support.
Daily Pivot Points for 8-19-05
| Symbol | Pivot | R1 | R2 | R3 | S1 | S2 | S3 |
| INDU | 10555.09 | 10592.74 | 10630.56 | 10668.21 | 10517.27 | 10479.62 | 10441.80 |
| SPX | 1219.20 | 1222.46 | 1225.91 | 1229.17 | 1215.75 | 1212.49 | 1209.04 |
| ES U5 | 1220.83 | 1224.92 | 1228.83 | 1232.92 | 1216.92 | 1212.83 | 1208.92 |
| SP U5 | 1220.97 | 1224.53 | 1228.07 | 1231.63 | 1217.43 | 1213.87 | 1210.33 |
| YM U5 | 10565.00 | 10610.00 | 10652.00 | 10697.00 | 10523.00 | 10478.00 | 10436.00 |
| BKX | 99.25 | 99.66 | 99.95 | 100.36 | 98.96 | 98.55 | 98.26 |
| SOX | 461.43 | 463.69 | 466.11 | 468.37 | 459.01 | 456.75 | 454.33 |
Weekly Pivot Points for Week of 8-15-05
| Symbol | Pivot | R1 | R2 | R3 | S1 | S2 | S3 |
| INDU | 10614.88 | 10704.84 | 10809.38 | 10899.34 | 10510.34 | 10420.38 | 10315.84 |
| SPX | 1231.92 | 1241.16 | 1251.94 | 1261.18 | 1221.14 | 1211.90 | 1201.12 |
| ES M5 | 1233.33 | 1242.42 | 1254.33 | 1263.42 | 1221.42 | 1212.33 | 1200.42 |
| SP M5 | 1233.37 | 1242.43 | 1254.27 | 1263.33 | 1221.53 | 1212.47 | 1200.63 |
| YM M5 | 10620.00 | 10714.00 | 10830.00 | 10924.00 | 10504.00 | 10410.00 | 10294.00 |
| BKX | 97.16 | 101.62 | 104.36 | 108.82 | 94.42 | 89.96 | 87.22 |
| SOX | 466.29 | 473.33 | 483.84 | 490.88 | 455.78 | 448.74 | 438.23 |
Please feel free to email me with any questions
you might have, and have a great trading week!
Chris Curran
Chris Curran started his trading career at the
age of 22 with a national brokerage firm. He combines fundamentals and
technicals to get the big picture on the market. Chris has been trading for 15
years, starting full time in 1997, and has never had a losing year as a
full-time trader.
