These are some key time ratios for next week
Kevin Haggerty is
the former head of trading for Fidelity Capital Markets. His column is
intended for more advanced traders. Kevin has trained thousands of traders
over the past decade. If you would like to be trained by him,
ext. 1
The market action was
ugly as NYSE volume expanded to 1.93 billion shares vs. 1.72 billion
shares on Tuesday and the volume ratio ended at 25 with 1.43 billion shares to
the downside. The 4 MA of the volume ratio is now 37. Breadth was -1089 and the
4 MA is -703. The 3 MA of the volume ratio is just 26 after the SPX declined
-2.3% in three straight down days to 1210.20 yesterday, -0.9%. The Dow was
-1.00% to 10,378, closing below its 200-day EMA and the QQQQ was -1.1% to 38.50.
Gold accelerated with the HUI, +4.3%, and XAU, +3.4%, along with energy, as the
XLE finished at +1.4%. The TLT advanced for the third day at +0.9%. Primary
sectors were led to the down side by the BKX and XBD, both -1.6%, SMH, -1.4%,
and RTH, -1.3% (led by Wal-Mart the past seven days).
The chemicals continue to get punished at -2.1%
yesterday with the stocks like Dow
(
DD |
Quote |
Chart |
News |
PowerRating) and DuPont
(
DD |
Quote |
Chart |
News |
PowerRating) now
down -28% and -30% from their highs–not your basic retracement for sure. The
XLB was led to the downside by chemicals like Dow, -3.9%, Rohm & Haas
(
ROH |
Quote |
Chart |
News |
PowerRating), -3%
(
PPG |
Quote |
Chart |
News |
PowerRating), -2% and
(
PX |
Quote |
Chart |
News |
PowerRating), -2.9%. They are now very short term
oversold. The bullish percent indices are both below 50% for basic materials and
consumer discretionary stocks, which is evidence of the Generals’ continued
reduction of their weightings in those sectors.
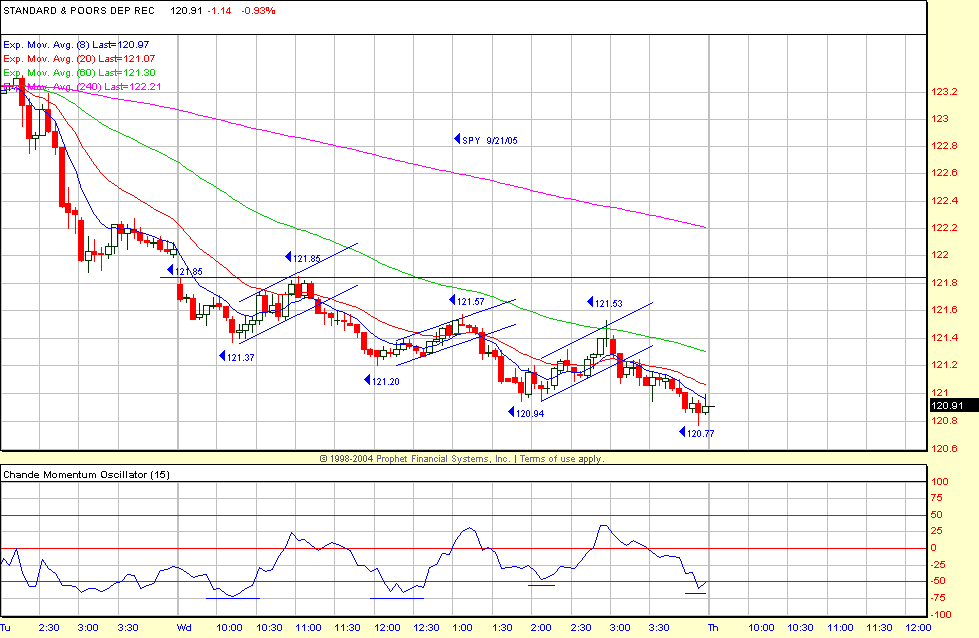
For daytraders in the SPY/futures it was
trend-down with three flag breakouts below all of the EMAs (5-minute chart), so
short players did well. If you also played from the long reversal side you made
some profits, but certainly not the same (see chart). The intraday SPY low was
120.77and no 60-minute chart RST can come into play unless the 120.39 low ofÂ
08/29 low is taken out. The DIA low yesterday was 103.62 and the 08/29 low of
103.45 must go before the same RST comes into play.
There are some key time dates into next week–the end of this third quarter.
September 26 is 233 days from the 10/25/04 bottom. September 28 is 144 days from
the 03/07/05 top and also 21 days from the 08/29 bottom. September 29 is the
1.618 ratio from the 07/07 – 08/29 bottoms. September 30 is the 1.272 ratio of
the 12/15/04 top to the 08/03/05 top. Today is also the 2.0 ratio from the
04/20/05 – 07/07/05 bottoms.
Suffice to say, there will be volatility and
opportunity into next week. I would imagine the Plunge Protection Team is ready
to step in and stabilize should there be a downside air pocket accelerated by
this new hurricane and the heavy media news. The Generals certainly want the SPX
to close at a minimum above the 12/13/04 close of 1211.92. As we enter this
short-term oversold zone, only index proxies should be carried overnight,
provided the initial day trade closes with a decent profit cushion.
Have a good trading day,
Kevin Haggerty

