Think Outside Of Just Your Own Time Frame
No matter what time frame you
trade in, it is always important to understand how your stock is
behaving in multiple times frames. This will give you perspective which others
who just look at one time frame may not have. With this perspective, you will be
able to better anticipate how a stock may move, due to the different types of
traders that would be involved in the stock. This should allow you to make more
informed trading decisions, potentially increasing your profits while reducing
your risks. For an example of this, lets look at some charts of
(
NBTY |
Quote |
Chart |
News |
PowerRating),
which broke out last week.

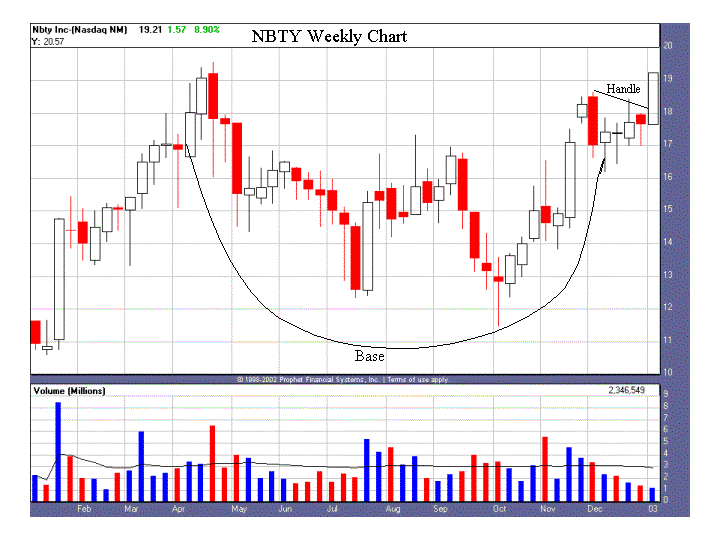
This first chart is a weekly chart, which shows a large
double-bottom base with a handle going back to last April. The handle began in
December and lasted about five weeks. This is the kind of chart that an
intermediate-term trader like Tim Truenbach would trade off of. (Tim’s
Jan. 7 column actually notes this breakout.) Intermediate-term traders
would have looked to buy this stock as it moved above the high of the handle on
the weekly chart.
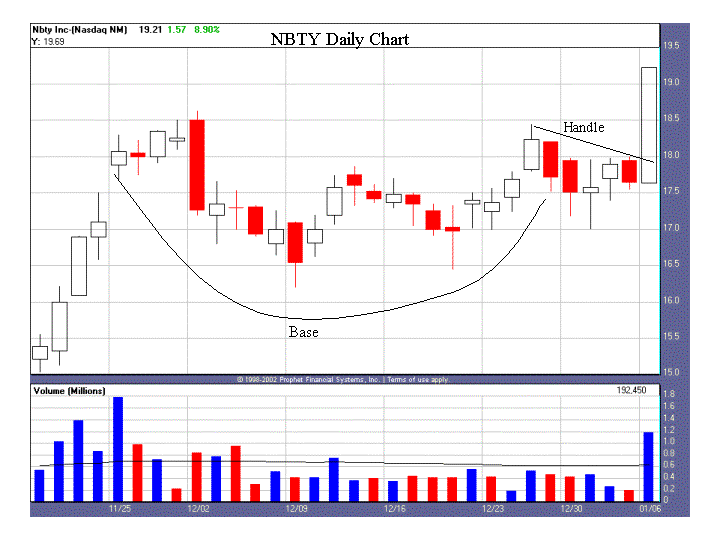
Our next chart is a daily chart, which highlights the right
side of the base and the handle:

What we see here is that, after running up from a low in
October (not shown — see weekly chart), NBTY formed what a swing trader like
Dave Landry might refer to as a “High Level Micro Double Bottom†or a “High
Level Micro Cup & Handle†(Dave
Landry on Swing Trading — Chapter 8), depending on how you look at it.
Someone using Landry-type swing trading techniques may have looked to enter this
stock either on a move above 18 (the approximate high of the last four days in a
row), or a move above the handle we see on this chart, which is slightly below
the high of the handle identified on the weekly chart.
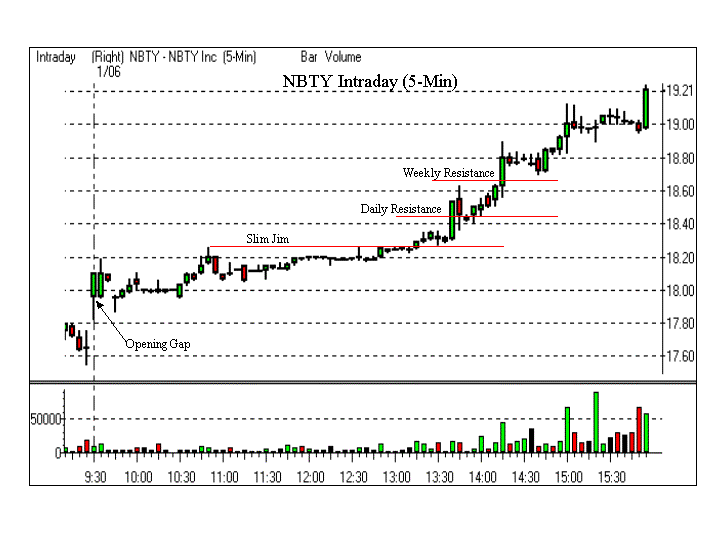
Lastly, let’s look at an intraday chart to see exactly how
the stock traded on the day of the breakout:

On the intraday chart you can see that NBTY gapped up at
the open nearly 2%, and was up over 3% within the first few minutes of trading.
This early action may have drawn the interest of day-traders. After holding
firm for most of the morning, it formed what Kevin Haggerty would refer to as a
“Slim Jim.†It broke out of the “Slim Jim†around 1:15pm. The first high
made after the “Slim Jim†formation was just under the daily resistance level
where swing traders may have looked to enter. The second high was made just
under the weekly resistance level where intermediate term traders may have
considered buying.
No matter what type trader you are in this scenario, you would have been well
served to understand what was happening in all three time frames. By
understanding who else is buying and selling the security and what methods they
may be using, you can better evaluate your risk/reward. The most important
thing to understand here is that once the weekly breakout occurred, all three
time frames were confirming each other. This would improve the odds of success
for people looking to trade this stock.
No matter what time frame you choose to trade in, or when
you might want to take the trade, you should be aware of the support,
resistance, and momentum being created by people trading off of the other
charts. This will allow you to better evaluate the risk/reward potential of
your own trade. Please note that in the above example I did the entire analysis
with nothing more than a simple price chart. If there are particular studies
that you like to look at on your charts, such as Stochastics, Bollinger Bands,
ADX, or anything else, then you should make sure to view those studies in all
time frames as well. The more time frames they confirm each other in, the
greater your risk/reward potential becomes. In this case, a day trader using
Bollinger Bands, and viewing the charts just before the breakout out of the
“Slim Jim†would have seen them pinching in on all three charts.
I believe that no matter what time frame you trade in, you
are always better served by being aware of what is happening around you. Just
like in sports or business, the better informed you are, and the better
understanding you have of what the competition is trying to do, the better you
can position yourself to outperform them. Anyone that reads
Don Miller’s articles will realize he always shows his charts in at least
three different time frames. Do not trade in a bubble. Even though you may
only be comfortable trading in one time frame, by viewing charts in many time
frames, and studying and understanding the methodologies that other traders may
be employing on those charts, you will undoubtedly increase your confidence as
well as your returns.
font-family:Arial;color:black”>
robhanna@rcn.com
