This chart pattern points higher
Friday’s session wasn’t. One look at
the charts for that 1/2 day non-event says it all.
What might we expect from here?
ES (+$50 per index point)
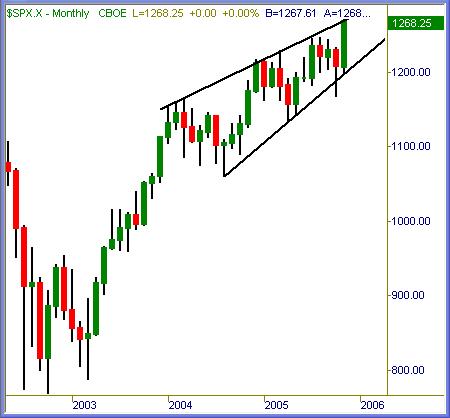
S&P 500 on a monthly chart view has hit upper
trendline resistance of a two-year ascending pennant pattern. This pattern has
formed thru three distinct flags or waves upward, with November’s pending candle
the pole of a fourth potential flag/wave higher. That of course assumes pattern
resistance will break… we could see a stall out here and drop to 1200s
trendline of support again. Anything is possible.
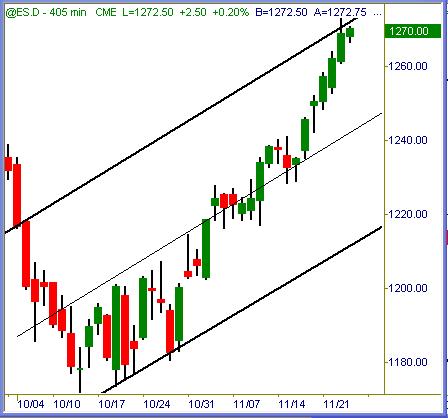
ES (+$50 per index point)
The daily chart channel pattern has evolved in
textbook fashion, with midline value projecting current highs as resistance
being reached. Price action needs to close and base above upper channel
line to confirm breakout potential for run to 1300s next. The 1245 level near
midline support should contain any profit taking from current elevations if
sellers start to cascade thru sell stops soon.
ER (+$100 per index point)
Russell 2000 has not reached upper channel
resistance yet, as it lags the bigger caps in this month-long rally. 670 is
first layer of firm support on any decline back to most recent congestion from
early this month.

Summation
Index markets are grossly overbought, for what that term is worth.
VIX levels are flat on the mat near decades low readings again. Seemingly the
whole world expects stock market prices to rise straight up from here. It would
be my guess that indexes are due for a pause or modest correction soon, possibly
starting this week. As always, we’ll trade what we see and let the charts guide
us up or down in harmony with the tape. Correct reaction to what the markets
desire is always preferred to guessing games that never win in the end.
Trade To Win
Austin P
(Weekend Outlook trend-view section…
open access)
Austin Passamonte is a full-time
professional trader who specializes in E-mini stock index futures, equity
options and commodity markets.
Mr. Passamonte’s trading approach uses proprietary chart patterns found on an
intraday basis. Austin trades privately in the Finger Lakes region of New York.