This ETF is approaching its buy zone
Traders returned from the holiday
weekend in aggressive selling mode yesterday,
causing the major indices to wipe out last week’s gains, and then some, in a
single day. The Nasdaq
(
COMP |
Quote |
Chart |
News |
PowerRating) plummeted 2.1%, its worst loss since the
broad market selloff began on May 11. Small-cap stocks were hit even harder,
which resulted in a 2.5% loss for the formerly market-leading Russell 2000
Index. It was the largest percentage loss for the Russell since October 5, 2005.
The S&P 500
(
SPX |
Quote |
Chart |
News |
PowerRating), S&P Midcap 400
(
MDY |
Quote |
Chart |
News |
PowerRating), and Dow Jones Industrial
Average
(
DJX |
Quote |
Chart |
News |
PowerRating) each sustained damage of 1.6% losses. Nearly all the broad
market’s losses were again the result of a steady intraday downtrend as opposed
to a large opening gap down. Since this month’s selloff began, there has been a
larger than average quantity of “trend” days in the market. This has provided
the benefit to traders of enabling stocks and ETFs to realize their volatility
through smooth intraday trends as opposed to large opening gaps that are
sometimes difficult to profit from.
Total volume in the NYSE rose by 15% yesterday, while volume
in the Nasdaq was 12% higher than the previous day’s level. The broad-based
losses on higher volume resulted in both the S&P and Nasdaq marking another
bearish “distribution day.” But despite the higher volume selling, volume levels
in both exchanges were still below average. Market internals were firmly
negative, as confirmed by the fact that every major industry sector we follow
closed lower yesterday. In the NYSE, declining volume exceeded advancing volume
by a huge margin of more than 8 to 1! The Nasdaq internals were better, but
still closed with a negative ratio of approximately 7 to 2. The discrepancy
between the NYSE and Nasdaq market internals indicates more selling pressure was
beneath the surface of the NYSE than the Nasdaq. Stocks in the NYSE are now
playing “catch up” to the large losses in the Nasdaq, which has been showing
more relative weakness than both the S&P and Dow until now.
Are you looking for an ETF to buy, perhaps in a cash account
that does not permit short selling, but are concerned by the broad weakness that
has struck both the U.S. and international markets? If so, we suggest you
take a look at a fresh specialty ETF that is completely uncorrelated to stock
market prices. The first exchange traded fund that enables you to participate in
the foreign exchange currencies markets, the Euro Currency Trust
(
FXE |
Quote |
Chart |
News |
PowerRating)
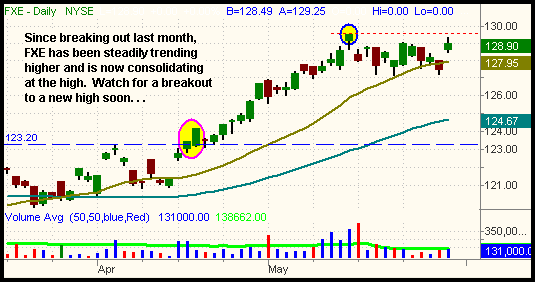
trades in direct correlation to the price of the Euro vs. the U.S. dollar.
Currently, the dollar is trading at 1.28 to the Euro. FXE closed yesterday at
$128.90, which is roughly equal to one hundred times that price. Because the
Euro is looking quite bullish right now, FXE is poised to break out higher as
well. As you can see on the daily chart below, FXE broke out in the middle of
last month, trended higher for for weeks, and has since been consolidating near
the high for the past two weeks. The 20-day moving average is also acting as
support:

Based on its bullish consolidation, FXE can be bought over its
May 12 high of 129.46. Aggressive traders might consider buying a partial
position just over yesterday’s high. A logical place for a protective stop loss
is below the recent consolidation, around the $127 area. Specific trigger, stop,
and target prices are provided to subscribers below. In addition to this
currency ETF, don’t forget about the other specialty ETFs such as those that
track the prices of commodities and government bonds. A complete listing of
all the ETFs presently trading on the U.S. markets, grouped by sector and
sub-sector for easy reference, is available for free by
downloading the
Morpheus ETF Roundup reference guide.
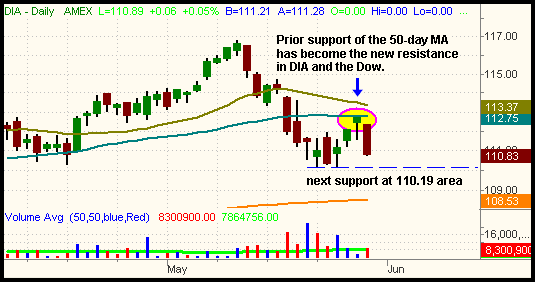
As for the major indices, one thing we like is how the Dow
Jones Industrial Average reversed perfectly after running into resistance of its
50-day moving average yesterday. Take a look at the daily chart of the Dow Jones
DIAMONDS (DIA), which we are currently short:

Last week’s low of 110.19 is the next support level in
(
DIA |
Quote |
Chart |
News |
PowerRating)
(11,030 in the Dow itself). If DIA breaks that low, it should quickly slide down
to its 200-day moving average at the 108.50 area.
The S&P 500, which we analyzed in yesterday’s newsletter, also
reversed nicely after running into resistance of its 38.2% Fibonacci retracement
level. The index closed yesterday right above its 200-day moving average that it
bounced off of last week. Obviously, that 200-MA is a pivotal support level, so
we’ll be watching to see whether the S&P again attempts to find support here or
if it quickly falls to new lows.
Open ETF positions:
Short DIA (regular subscribers to
The Wagner Daily
receive detailed stop and target prices on open positions and detailed setup
information on new ETF trade entry prices. Intraday e-mail alerts are also sent
as needed.)
Deron Wagner is the head trader of Morpheus Capital Hedge Fund and founder of
Morpheus Trading Group (morpheustrading.com),
which he launched in 2001. Wagner appears on his best-selling video, Sector
Trading Strategies (Marketplace Books, June 2002), and is co-author of both The
Long-Term Day Trader (Career Press, April 2000) and The After-Hours Trader
(McGraw Hill, August 2000). Past television appearances include CNBC, ABC, and
Yahoo! FinanceVision. He is also a frequent guest speaker at various trading and
financial conferences around the world. For a free trial to the full version of
The Wagner Daily or to learn about Deron’s other services, visit
morpheustrading.com or send an e-mail to
deron@morpheustrading.com .
Â
