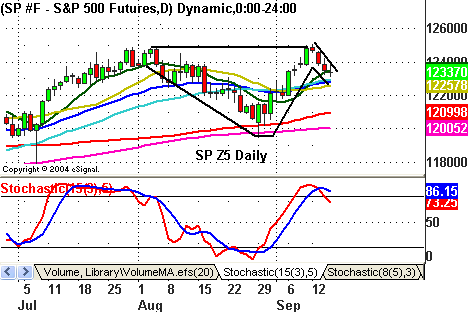
This indicator I rely heavily on says stay long the S&Ps
Stock index
futures opened Thursday’s session higher after an inflation-friendly CPI number
took the focus away from another uptick in crude oil. But, just like Wednesday,
the higher open couldn’t be trusted and the futures spent the first hour
trapping the gap buyers. A move back to the open was stymied by a pretty sick
Philly Fed reading, that showed manufacturing in the region barely hanging
above negative territory. The futures chopped around the rest of the session
with pockets of volume that were indicative of options expiration.
Do You Have A Plan- A
Serious, Genuine Business Plan?
Imagine you have a rich relative willing to grubstake you $500K if you can provide
him with a solid outline of your methodology and why you know that methodology will be
profitable. He’s a skeptical hard-ass but willing to read what you’ve written
down. Would you be able to convince him with what you’ve got now?
Even if you are totally discretionary, you should be able to articulate and
justify, in clear words on paper, the reasoning behind every action you
take. Discretionary traders are ultimately systematic too because they
just trade conceptual patterns instead of mechanical ones.  Also,
articulating that you take trades “because the chat room moderator said so”
isn’t justification for anything other than being a complete loser.
Some things that you should be considering are the following:
When do you enter and why? When do you add? When do you exit and
why? What is your planned risk per trade? What is your typical Risk/Reward target
per trade? What is your survivability quotient (i.e. how many losses in a
row would it take to kill you?). How feasible is your planned risk in regards to
matching up with real world volatility risk (i.e. what would a five point jump
do to your half point stop?). Are your range captures realistic or too close to
random? Are you using viable software or trying to get by with a cheap piece of
crap? On and on it goes.
Daily Pivot Points for 9-16-05
| Symbol | Pivot | Â Â Â Â Â R1 | R2 | R3 | S1 | S2 | S3 |
| INDU | 10553.92 | 10586.90 | 10615.06 | 10648.04 | 10525.76 | 10492.78 | 10464.62 |
| SPX | 1228.15 | 1231.46 | 1235.18 | 1238.49 | 1224.43 | 1221.12 | 1217.40 |
| ES Z5 | 1234.25 | 1237.75 | 1242.00 | 1245.50 | 1230.00 | 1226.50 | 1222.25 |
| SP Z5 | 1234.23 | 1237.77 | 1242.03 | 1245.57 | 1229.97 | 1226.43 | 1222.17 |
| YM Z5 | 10594.00 | 10628.00 | 10659.00 | 10693.00 | 10563.00 | 10529.00 | 10498.00 |
| BKX | 97.49 | 97.78 | 98.08 | 98.37 | 97.19 | 96.90 | 96.60 |
| SOX | 475.42 | 478.50 | 483.74 | 486.82 | 470.18 | 467.10 | 461.86 |
Weekly Pivot Points for Week of 9-12-05
| Symbol | Pivot | Â Â Â Â Â R1 | R2 | R3 | S1 | S2 | S3 |
| INDU | 10607.39 | 10767.09 | 10855.62 | 11015.32 | 10518.86 | 10359.16 | 10270.63 |
| SPX | 1234.71 | 1249.90 | 1258.32 | 1273.51 | 1226.29 | 1211.10 | 1202.68 |
| ES Z5 | 1239.42 | 1259.58 | 1270.42 | 1290.58 | 1228.58 | 1208.42 | 1197.58 |
| SP Z5 | 1240.77 | 1258.03 | 1267.57 | 1284.83 | 1231.23 | 1213.97 | 1204.43 |
| YM Z5 | 10647.33 | 10808.67 | 10898.33 | 11059.67 | 10557.67 | 10396.33 | 10306.67 |
| BKX | 98.94 | 99.51 | 100.09 | 100.66 | 98.36 | 97.79 | 97.21 |
| SOX | 477.74 | 487.46 | 492.77 | 502.49 | 472.43 | 462.71 | 457.40 |
Please feel free to email me with any questions
you might have, and have a great trading week!
Chris Curran
Chris Curran started his trading career at the
age of 22 with a national brokerage firm. He combines fundamentals and
technicals to get the big picture on the market. Chris has been trading for 15
years, starting full time in 1997, and has never had a losing year as a
full-time trader.