This Is All I Believe Traders Need
Another summer week
comes to a close, with the S&Ps closing down about eight and the
Nasdaq down about 23 from Friday’s close.
Friday’s rebound helped to minimize damage
done earlier in the week, albeit with the Nasdaq doing one of its
better dead cat impressions, or at least one that seems to be
struggling with a hairball in the thin air.
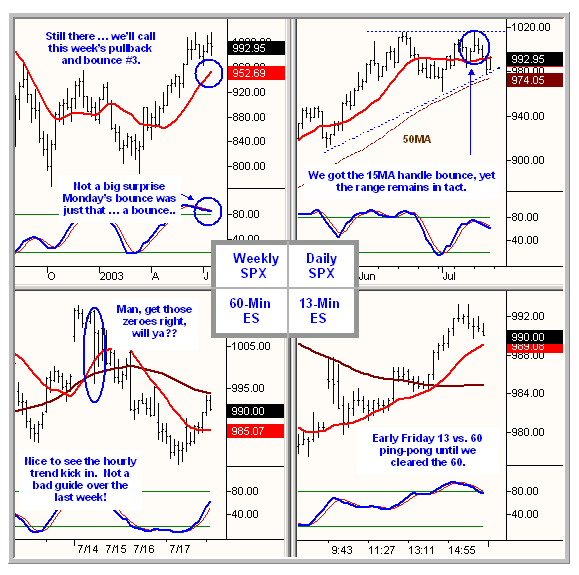
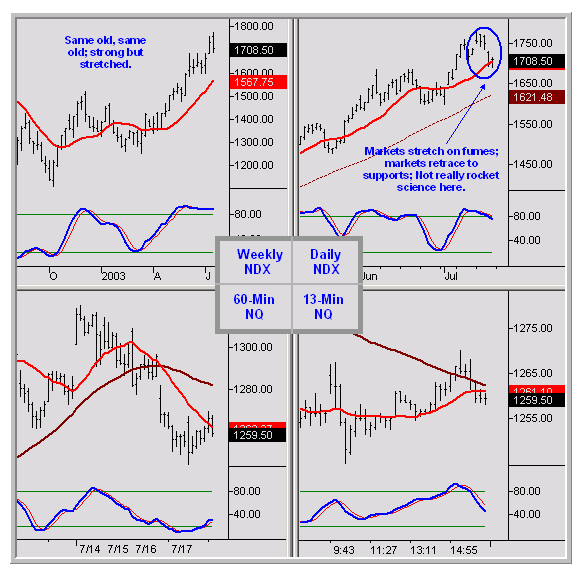
As noted in the daily NDX chart below, the week-long Nasdaq
retracement wasn’t exactly rocket science — despite the deafening
bandwagon roar we mentioned last week — although some on the wagon
may want to take a summer school refresher of the 1999-2001 lesson on
market science, specifically the chapter written by Wile E. entitled
“gravity.”
And speaking of gravity, let’s hope E-Mini program trading errors
aren’t becoming a bi-weekly occurrence. I’m of course referring to
Monday’s twenty point plunge that required a bit of deft trade
management, not to mention cause for real and synthetic pacemakers to
jump a bit. As expected, the CME busted all trades outside reality
limits, not to mention a few bubbles on the part of newer traders that
thought they received a gift on long executions sub-996.
All in all, trading pace of both key markets was actually pretty
decent for a summer week full of earnings-influenced gyrations, as the
three, 13, and 60-minute charts all provided strong guides throughout
the week. Let’s peek at the charts and then address a few questions
stimulated by last week’s columns.
S&P 500

NDX 100

Moving Avg Legend:
15MA
Larger Timeframe
15MA
See https://www.donmillertrading.com
for Setups and Methodologies
Charts © 2003 Tradestation
Simplicity
I received some mail last week asking me what I thought about the
studies that Larry Connors mentioned in
last week’s Battle Plan piece. You may recall these studies
revealed that Moving Averages and Momentum indicators used as triggers
were rather horrid indicators and resulted in net losses over time. I
believe a similar conclusion was reached by one of the leading analyst
firms a year ago or so. One of the specific questions I received was
how such a study result could be reconciled with my use of similar
indicators in the column and courses.
My response was that such studies actually reinforce my belief
that any single indicator is worthless, which is why I feel strongly
about encouraging the use of trend, strength, and range
indicators with which to base trade decisions — the absence of one or
two resulting in a method as effective as a one- or two-legged stool.
For example, let’s look at moving average crosses. Are they relevant?
Well, yes and no. Do strength vs. price divergences exist to show
slowing trend momentum with an alert for a possible trend reversal? Is
a lesser timeframe signaling a likely extension of a larger timeframe?
If yes, then a price-MA cross or a MA-MA cross can be highly
significant. On the other hand, are range bands tight reflecting a
period of market consolidation? Then crosses likely mean
nothing/nada/zilch as we look for other clues of a pending breakout.
OK, let’s look about overbought/oversold indicators. One of the more
popular ones is to buy the market when the stochastics are less than
20 and sell when over 80 … we all learn that in Trading 101, right?
Oh, and the next time we fly, let’s ask the pilot to land the plane by
solely looking at the fuel gauge — NOT! Are we trending? What are the
slopes of the trend supports? How far is price stretched from
supports? Are there divergences? It’s traders asking those
decisions that will make some sense out of this game.
Yes, all indicators are simply lines on a chart to help make some
sense of mass market psychology and the market certainly doesn’t
“have” to honor them. And a 3-minute timeframe may be in serious play
while the hourly treads water. Yet we can, and in my view, should
still stress simplicity on the technical side to the extent possible,
and keeping trading as simple as possible will remain my
premise until I breathe my last breath. Today’s 13 vs. 60 minute 15MA
conflict was a classic natural triangle guide for scalpers, and the
13-minute trend we drill in the video and simulations has provided as
good as a backdrop over the last three days as one can find.
Last week, we discussed my passing on the hypothetical option of
having all of the industry bells and whistles in terms of news feeds,
chat rooms, newsletters, high-probabilistic methods, and the like. And
needless to say, the competition for such services from the
pick-sellers is fierce and deafening. It was a huge pet peeve of mine
when I first entered this hallowed industry that spits out trader
after trader, and has only grown over time.
You see, when I was blessed with executive leadership opportunities in
my pre-market days, my attitude was typically “let’s cut to the chase,
folks” in tackling issues. Yes, without trees there would be no forest
— yet if we’re addressing a fire situation do we really need to know
whether the trees are scrub pine or hemlock? (which of course is
only relevant to the
suppliers
of future pine and hemlock stock.) So when I first entered this
industry, I was aghast at some of the overwhelmingly complex technical
foundations, which seemed analogous to flying to the next city to
visit a wholesale club in search of a stick of gum.
Similarly in terms of selecting methods, does it really matter which
one we use? Certainly, find one that’s comfortable and fits your
personality… but despite the deafening “pick me, pick me” (remember
the donkey in Shrek???) industry mantra, we should keep in mind that
every bona-fide method or trade setup on this planet is designed to do
the same thing, which is to skew probability in your favor over
time.
Simplicity. On the technical side, show me trend, strength, and range
indicators on a couple of timeframes and I’ll be content trading
tiddly winks over the phone. For the true challenge in this business
should not be in constantly wrestling with the method, rather in
striving to tackle the internal and self-defeating demons between the
ears that can limit our effectiveness. That’s how I want to
spend self-improvement time.
Yes, I suggest a combination of simple technical indicators, some of
which are as old and exciting as dirt. For me, simplicity works and
it’s all I believe traders need. Markets trend, stretch, chop, and
retrace on varied timeframes, and despite what vested-interest bulls
or bears would have you believe, do ultimately reverse. Certainly, the
duration of each leg will vary as often as the New England weather and
Red Sox bullpen, so the use of the term “simplicity” certainly should
not infer “ease”, as interpretation and effective trade management
will always be key.
Yet when tackling a jigsaw puzzle, I’d still rather spend time looking
at the picture on the box and start with the border to assemble the
pieces, versus measuring each piece’s perimeter with a ruler.
In response to
last week’s column:
Bit by bit I am
getting more sure now that I’m finally learning this business, Don.
Unless I just can’t make this method meet my longer-term needs, I am
probably not going to be a method sampler any more. But I do think it
will work for me, on average, so I am more and more focused on it. And
from your column this weekend, I think/hope you would approve with my
decision. And that’s nice to know!
Thanks again for your
great lessons — J.B.
Sounds like a plan J.B.
Good Trading and Have a Great Weekend!
Don Miller
