This Is One Way To Combine Retracement Levels And Trendlines
The market is trapped in
a narrow trading range, but it is moving inside of a rising channel
as you can see on the 10-minute chart of the S&P 500
Index. Currently the index is at 1190.89, up 2.82.
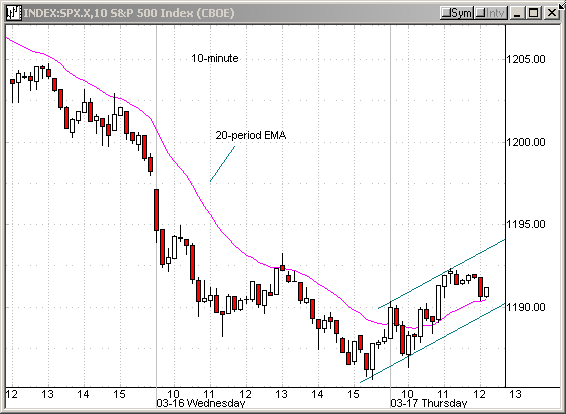
09:48:12 (From TradersWire)
![]()
|
Action |
Symbol |
Order Type |
Setup |
Stop |
 Target |
Current Price |
Posted By |
|
Buy |
MRVL | buy stop at 35.86 | Pullback |
35.71 | 36 | 35.76 |
TK |
MRVL
opened slightly below yesterday’s close, but it quickly reversed to the upside.
After hitting 36.17, the issue began to pull back. As you can see below, the
stock never violated the 50% retracement level (yesterday’s low – today’s high).
It also formed a declining trendline. It could try to break above, so I decided
to place a buy stop at 35.86.
09:54:23
Follow up on MRVL
It has reached our target. Sell half and move stop to breakeven.
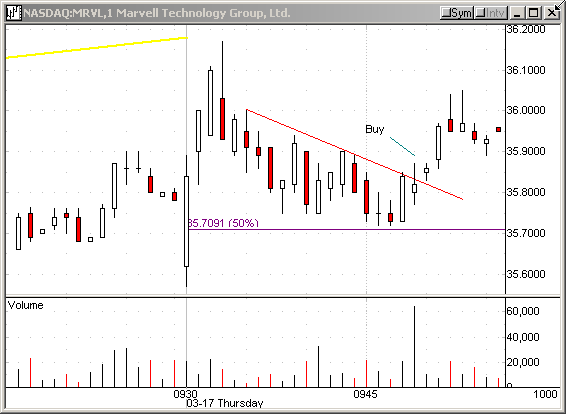
(1-minute chart)
T.Kamada
If you have questions, feel free to
mail them to me.