This Is One Way To Use A Mini Double Bottom In Your Trading
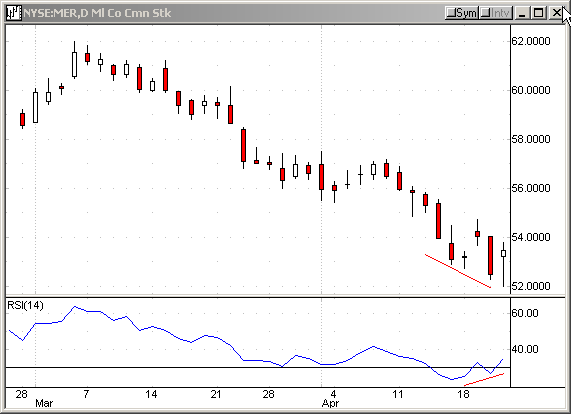
Merrill Lynch (MER)
formed a bullish tail yesterday and looked ready for a minor recovery
rally. Also notice the 14-period RSI was showing a positive divergence.

(Charts courtesy of QCharts)
11:01:02 (from TradersWire)
![]()
|
Action |
Symbol |
Order Type |
Setup |
Stop |
 Target |
Current Price |
Posted By |
|
Buy |
MER | buy stop at 53.63 | pullback | 53.48 | 53.90 | 53.59 |
TK |
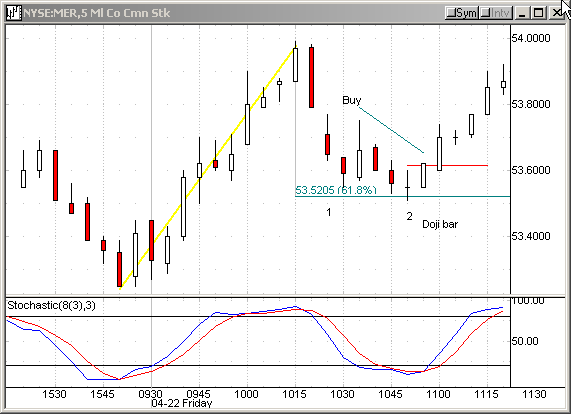
Now, let’s look at the 5-minute
chart from this morning. MER hit 53.99 shortly after 10:15 and began to pull
back. As you can see, it formed a mini double bottom just above the 61.8%
retracement level. Take a look at the second bottom. MER shaped a doji bar
(open=close). It was a potential reversal situation. I placed a buy stop at
53.63.
11:19:48 (from TradersWire)
Follow up on MER (Pt 3)
It has hit our target. Sell the rest or re-adjust your stop.

If you have questions, feel free to
mail them to me.
