This Is Why You Should Check Weekly Charts
Many traders and
investors look at longer time frame charts to check the directional bias of the
stocks. For example, if a stock is exhibiting a strong uptrend on its
weekly chart, we can get a better buying opportunity when the stock begins to
pullback from the high on its daily chart.
10:43:32
(From TradersWire)
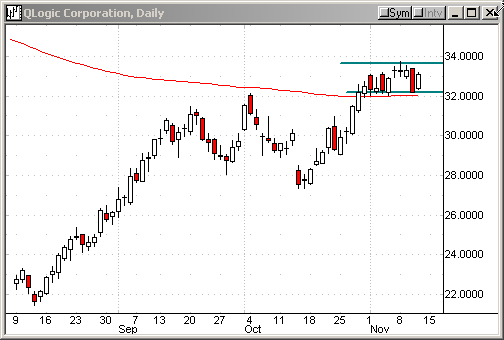
QLogic Corp (QLGC)
is bouncing off its 200-day EMA. Long QLGC if it takes out 32.90. Target is the
November 8 high (33.74). Place a stop below today’s low (32.31), or risk 1.00.
QLGC is at 32.81, up 0.61.
As you can see below, the 200-day EMA has been a strong support for QLGC. It
sold off yesterday, but the MA was never violated. Also notice, the stock is
forming a trading range. Can it break above the range?
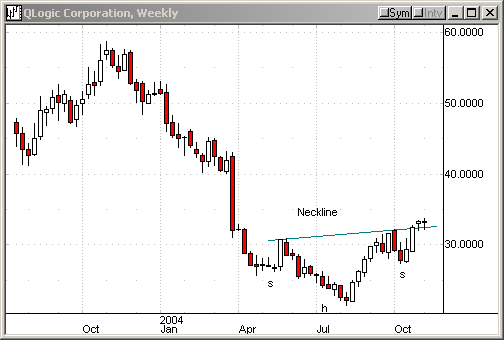
Now, switch to the weekly chart. QLGC is shaping an inverse head-and-shoulders
pattern. It has already taken out the neckline. It appears the issue is ready to
take out the November 8 high.
Have a profitable afternoon session!
If you have questions, feel free to mail them to me.