This is why you should follow market leaders
As a precocious ten-year old, my daughter Devon wrote to well-known authors
and speculators Victor Niederhoffer and Laurel Kenner and explained her view of
the stock market. The market, she opined, was like a school of fish.
To figure out which way the school would turn, you only needed to follow the
lead fish. The challenge for market analysts is figuring out which stocks
are the lead fish.
In my last article, I wrote about five e-Conomy stocks that were
distinguished by their upward trending movement and their high dollar volume of
trade. The e-Conomy Index, created by equally weighting the five issues,
has been an excellent performer since August, 2004, gaining nearly 150% in that
time–much higher than the roughly 6% returned by the S&P 500 Index over the
same period.
Might the e-Conomy stocks be credible lead fish
for the NASDAQ 100 average
(
QQQQ |
Quote |
Chart |
News |
PowerRating)?
To examine that question, I analyzed five-day change periods since August,
2004 (N = 308). Over that time, the average five-day change in the QQQQ
has been .31%, with 173 periods advancing and 135 declining. When we
divide five-day periods into equal halves and look at what happens after strong
vs. weak periods in the QQQQ, the next five days shows evidence of
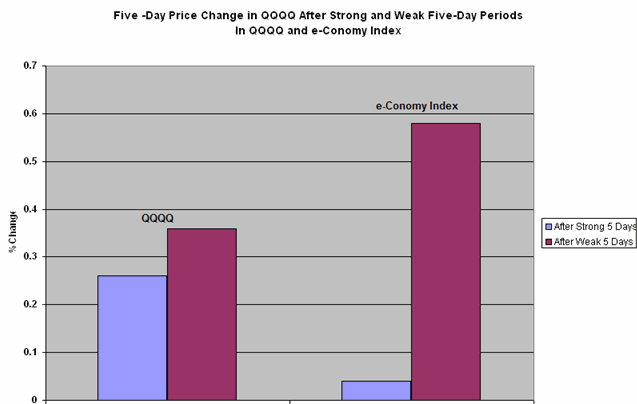
reversal. After strong five-day periods in the QQQQ, the next five days
average .26% (93 occasions up, 61 down), but after weak five-day periods in the
QQQQ, the next five days average .36% (108 up, 46 down). This is
consistent with results reported by Larry Connors and Conor Sen, whose book
How
Markets Really Work found that strong returns tended to follow weak market
periods and vice versa.
This reversal effect, however, might be stronger if, indeed, the e-Conomy
stocks act as lead fish. Once speculative traders have jumped in or out of
the e-Conomy issues, there would be fewer left to fuel a subsequent market
rise. Sure enough, as the chart below indicates, the strongest half of
Index returns over a five-day period yield an average QQQQ change of only .04%
over the next five days (80 occasions up, 74 down). The weakest e-Conomy
Index returns over five days, however, are followed by an average QQQQ change of
.58% (93 occasions up, 61 down). The five e-Conomy issues are leaders, but
not in the usual sense of trend following. Rather, as the chart indicates,
they lead market reversals.

These results raise interesting questions regarding market
indices other than the QQQQ. Might there be different lead fish that
predict reversal in the S&P 500 Index, the Dow Jones Industrial Average, the
Russell 2000 small cap index, or sector indices such as those for semiconductors
or biotechnology stocks? Are there different lead fish for bull and bear
phases of a market cycle, and do the lead fish differ across market
cycles? Good research provides useful answers, but the best research asks
promising questions.
Brett N. Steenbarger, Ph.D. is
Associate Clinical Professor of Psychiatry and Behavioral Sciences at SUNY
Upstate Medical University in Syracuse, NY and author of
The Psychology of Trading (Wiley, 2003). As Director of Trader
Development for Kingstree Trading, LLC in Chicago, he has mentored numerous
professional traders and coordinated a training program for traders. An active
trader of the stock indexes, Brett utilizes statistically-based pattern
recognition for intraday trading. Brett does not offer commercial services to
traders, but maintains an archive of articles and a trading blog at
www.brettsteenbarger.com. He is
currently writing a book on the topics of trader development and the enhancement
of trader performance.
