This Is Why You Should Look At The 15-Minute Chart
I’m sure many market
participants are waiting for a pullback. For a moment I thought the
market was ready to go down.
11:28:34
(From TradersWire)
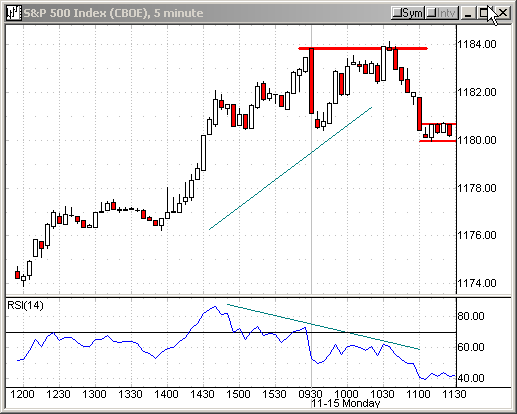
 S&P 500 Index ($SPX.X) has failed to
day’s low. $SPX.X is at 1180.67, down 3.50.
The index tried, but it could not break above last Friday’s high. Notice, the
14-period RSI is negatively diverging. Finally, I thought the market would give
us a decent pullback.

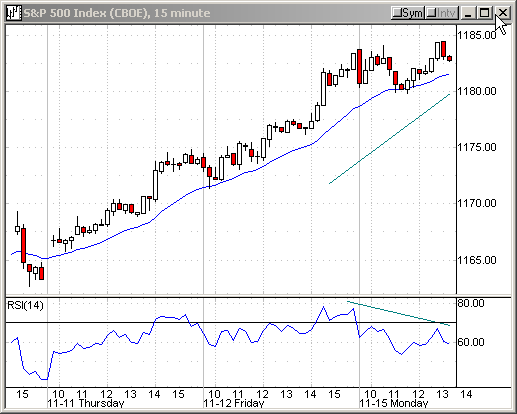
But, the market refused to go down any further. It tested its 20-period EMA
successfully on its 15-minute chart and resumed its uptrend. Take a look at the
RSI again. It is showing a negative divergence. Should we short the index? So
far, we are not seeing aggressive sellers yet.  Â

Have a nice afternoon session!
If you have questions, feel free to mail them to me.
