This Is Why You Should Look At The Weekly Chart
Which time frame chart
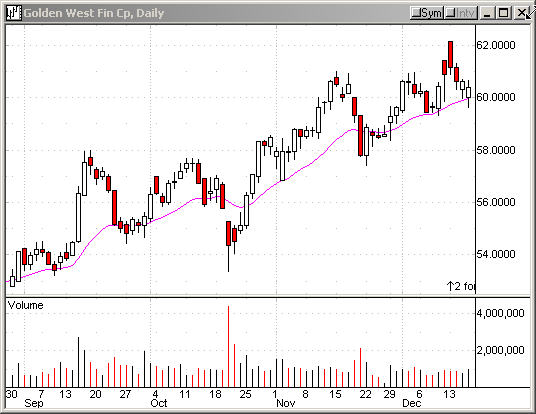
do you look at first? Below you can see the daily chart of Golden
West Financial (GDW) as of yesterday’s close. The issue tested the 20-day
EMA successfully and finished near the day’s high. Naturally, we are looking for
a resumption of the uptrend.

10:02:28 (TradersWire)
![]()
| Action | Symbol | Order Type | Setup | Stop | Current Price |
| Buy | GDW | Stop at 60.65 | Pullback |
60.45 | 60.50 |
About 20 minutes later, we could manage to
capture a 20-cent gain.
10:25:05
Follow up on GDW Â
Sell half to lock in 20cents profits. Move stop to breakeven.
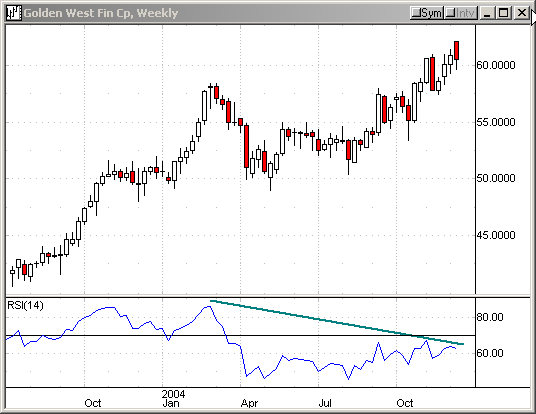
Now, take a look at the weekly chart. Why the weekly? Because it is used by the
mid- and long-term investors to make their investment decisions. In other words,
you can understand how investors think by utilizing the weekly charts. Anyway,
the weekly chart of GDW does not look as bullish as the daily. In fact, I should
say the weekly is sending us a warning signal. Notice, the RSI is negatively
diverging. Maybe the long-term investors are taking profits. Check the weekly
charts. It will help your trading.

If you have questions, feel free to mail them to me.  Â
