This Is Why You Should Watch The Previous Day’s Low
If a stock is declining,
where is it going to find a support? Moving average lines, horizontal
support lines, and Fibonacci retracement levels, there are many possibilities.
11:36:47 (From TradersWire)
![]()
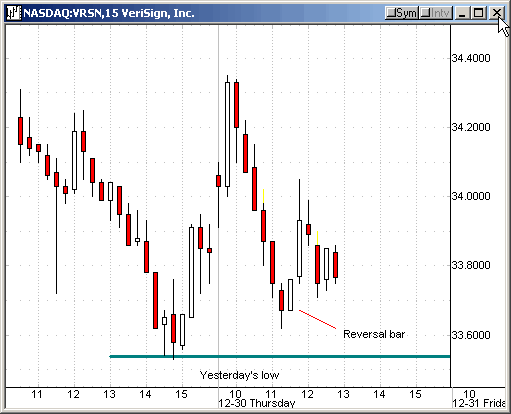
| Action | Symbol | Order Type | Setup | Stop | Current Price |
| Buy | VRSN | Market | double bottom | 33.61 | 33.74 |
After hitting 34.35, VRSN began to sell off. What
price level could be a potential support? Where can we consider buying the
stock? As it turned out, VRSN approached yesterday’s low. It did not quite get
there, but the stock started to form a double bottom on its 15-minute chart.
After confirming a reversal bar, we decided to buy it at the market.    Â
11:56:45
Follow up on VRSN
Sell half to lock in a 10-cent profit. Adjust your stop to breakeven.
12:07:36
Follow up on VRSN (Pt.2)
Raise stop to 33.88 on the rest.
Have a productive afternoon session!
If you have questions, feel free to mail them to me.
Â