This Tide Will Turn
In
a week that is supposed to show
seasonal holiday strength, so far the exact opposite has happened. As I write this on Wednesday morning, there is
simply no place to go for the intermediate trader. The high multiple glamour
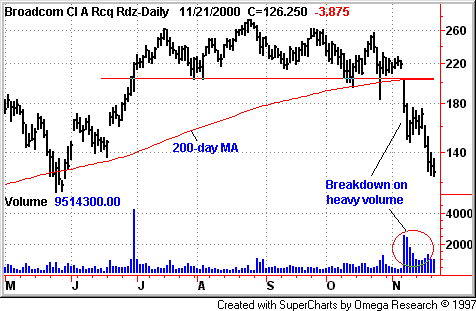
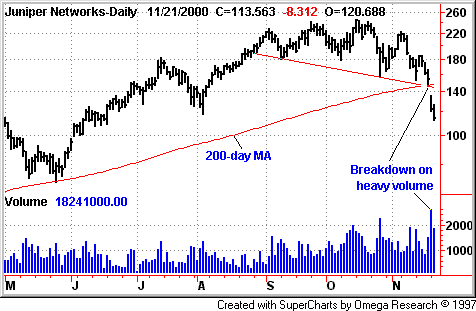
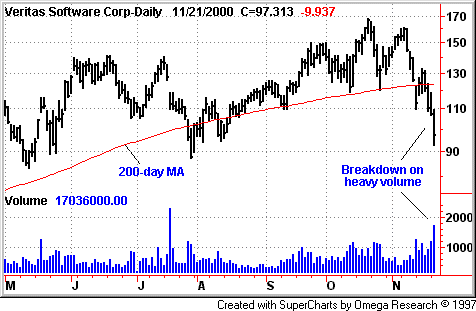
stocks are being ripped apart at the seams. I am not talking about any ordinary
drop. I am talking bungee jumps. The following charts of previous leaders speak
for themselves.


I am not
showing these charts to scare you. I am showing them to let you know how much
risk there is in this market as it goes after all leadership. I continue to urge
caution as every day it seems several more “blow-ups” occur. Be
assured the damage that has been done is significant and will take months to
repair. It is also not exciting that all major indices continue to trade below
their 50- and 200-day moving averages. To make matters worse, new highs are
contracting and new lows are expanding.
The one
bright spot we are starting to notice is that large-cap tech is starting to show
decent accumulation. Names like Cisco
(
CSCO |
Quote |
Chart |
News |
PowerRating), Microsoft
(
MSFT |
Quote |
Chart |
News |
PowerRating) and
Nokia
(
NOK |
Quote |
Chart |
News |
PowerRating) are at least trying to end their steep drops. Do keep in mind
that there is a lot more work to be done, but if the bigger names can get legs,
maybe more will follow. Hey, I have to have a little hope!
Speaking of
hope, I did want to end this report on a positive note. It’s about the potential
of the next big move. The following numbers speak for themselves.
| DATE OF BEAR |
DECLINE IN DOW |
NEXT RALLY |
| 5/46-6/49
|
-25% | 84%Â OVER 43 MONTHS |
| 4/56-10/57
|
– 21% |
65%Â OVERÂ 27 MONTHS |
| 11/61-6/62
|
-29% | 91%Â OVERÂ 44 MONTHS |
| 1/66-10/66
|
-27% | 35%Â OVER 26 MONTHS |
| 11/68-4/70
|
-37% | 70%Â OVERÂ 32 MONTHS |
| 1/73-10/74
|
-47% | 80%Â OVERÂ 22 MONTHS |
| 10/76-3/78
|
-28% | 40%Â OVERÂ 39 MONTHS |
| 4/81 -8/82
|
-25% | 257% OVERÂ 62 MONTHS |
| 8/87-10/87
|
-41% | 87%Â Â OVERÂ 33 MONTHS |
| 7/90-10/90
|
-22% | 302% OVERÂ 95 MONTHS |
| 7/98-10/98
|
-22% | 59%Â Â OVER 16 MONTHS |
The Nasdaq is
now 44% off its highs. This type of drop in a major index does not happen very
often. I continue to urge you to double your efforts. The average investor is
scared. The average investor is panicky. Don’t be the average investor. The
numbers above are meaningful. Eventually the tide will turn. The smart investor
will start searching for common patterns of the biggest winners of the last bull
move. While the names will change, characteristics of the biggest winners of the
next big move will not.
In the
meantime, eat a lot of food, watch a lot of football … and have a great
Thanksgiving holiday!
