Three New Twists For The Global Markets
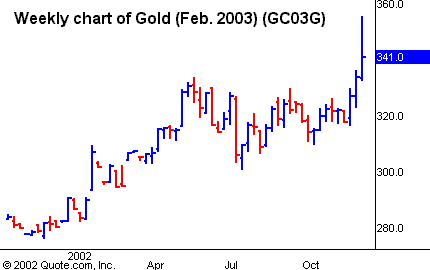
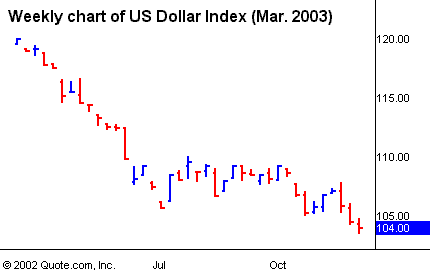
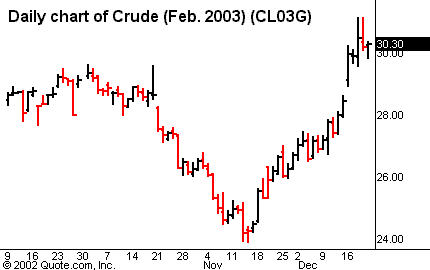
The new twists for the global markets are
marginal breakouts in gold, the Euro against
the dollar, commodity indexes and
oil
prices. Follow through up to new highs in oil, gold, and commodity indexes,
confirmed by a decline to new lows in the dollar index will be solid
confirmation that we are in a new trend and a new era that will favor real
assets, possibly for some time. Such a move would make the deflation threat go
on the backburner as well. Investors need to watch carefully for what could
well be a MAJOR shift in the environment. Yet
realize that the one wild card remains ever present — war with Iraq and
terrorism can lead to massive immediate shifts in perceptions and
expectations.
Investors following
our strategy are continuing to wait with their finger on the trigger for the
emergence of more evidence of breadth, follow-through and leadership before
increasing allocation to the long-side with any significance. It would be very
helpful to have more breadth thrusts like another follow-through day up, a 9/1
up/down volume day, 5-day moving average of advancing volume to be 77% or more
of total volume, an 11-day A/D ratio of 1.9 or more, or a 10-day A/D ratio of 2
or more. While concerted intervention and fiscal stimulus plans make it likely
that absent a shock any weakness should not break the October lows, so far this
rally has been mainly concentrated in the weakest stocks of the prior bear move,
and leadership is BARELY showing signs of
life. The stocks that have broken out have not had solid continuation, though
there are signs this is beginning to improve. If
volume, breadth, leadership, and follow-through can emerge, we
suspect this rally could develop into the strongest and longest bear-market
rally we’ve seen since the March 2000 peak. Let’s tip-toe into the longside here
while continuing to wait with substantial allocation for stronger evidence of
leadership and follow-through.
Since March 2000 the world index is down over
45%, the S&P over 48%, the IBD mutual fund index is down over 62%, and the
Nasdaq has crashed over 76%. Meanwhile since March 2000 the long/short strategy
we summarize and follow-up each week in this column has made more than 38% on a
worst drawdown of under 6%.
While this performance is certainly
underperforming our long-term growth rate, and it is hardly thrilling to have
been so heavily in cash since March of 2000, we have managed to eke out gains
with very low risk in a very dangerous market environment where 9 out of 10
traders have been big losers.
Our official model
portfolio overall allocation remains VERY DEFENSIVE. We’re now 92% in T-bills
awaiting new opportunities, with one sole long position.
Our model portfolio followed up weekly in this column was
up 41% in 1999, up 82% in 2000 and up 16.5% in 2001 — all on a worst drawdown of
around 12%. We’re now up around 7.56% for the
year 2002.
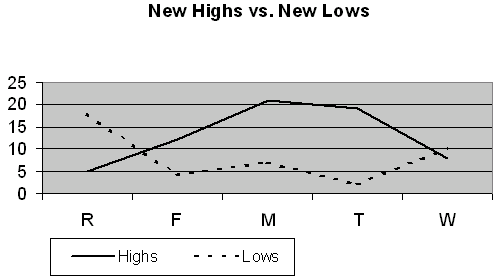
Unbelievably
Top RS/EPS New Highs have still mustered up just ONE solid week of
consistent +20 or higher readings since the 7/24 lows. Readings this week were
5, 12, 21, 19, and 8, accompanied by just 7 breakouts of 4+ week consolidations
within these new highs, with a few close calls on stocks like
(
BSTE |
Quote |
Chart |
News |
PowerRating),
(
CPBI |
Quote |
Chart |
News |
PowerRating),
and
(
CRAY |
Quote |
Chart |
News |
PowerRating). While follow-through is improving on recent close-calls,
breadth is back in the pathetic range. Let’s see if we can get 20+ breakouts
consistently, some follow-through on close-call breakouts, and some consistent
group leadership. We ain’t there yet. Bottom
RS/EPS New Lows are stuck in the no opportunity zone with readings of 18,
4, 7, 2, and 10, accompanied by just one close call in MTF. Notice that our
analysis of new low breakout quality helped keep us from getting trapped on the
overly bearish side of the market in the decline from late August, and that
we’ve missed some potential traps on the upside so far in this deceptive rally.
For those not
familiar with our long/short strategies, we suggest you review my book
The Hedge Fund Edge, course “The Science of Trading,” and
new video seminar most of all, where I discuss many new techniques.
Basically, we have rigorous criteria for potential long stocks that we call
“up-fuel,” as well as rigorous criteria for potential short stocks that we call
“down-fuel.” Each day we review the list of new highs on our “Top RS and EPS New
High List” published on TradingMarkets.com for breakouts of four-week or longer
flags, or of valid cup-and-handles of more than four weeks. Buy trades are taken
only on valid breakouts of stocks that also meet our up-fuel criteria.
Shorts are similarly taken only in stocks meeting our down-fuel criteria that
have valid breakdowns of four-plus-week flags or cup and handles on the
downside. In the U.S. market, continue to only buy or short stocks in leading
or lagging industries according to our group and sub-group new high and low
lists. We continue to buy new signals and sell short new short signals until our
portfolio is 100% long and 100% short (less aggressive investors stop at 50%
long and 50% short). In early March of 2000, we took half-profits on nearly all
positions and lightened up considerably as a sea change in the
new-economy/old-economy theme appeared to be upon us. We’ve been effectively
defensive ever since.
Upside breakouts
meeting up-fuel criteria (and still open positions) so far this year are:
(
PORT |
Quote |
Chart |
News |
PowerRating)
@40.99 (44.8) w/ 41.1 ops. Continue to watch our NH list and buy flags or
cup-and-handle breakouts in NH’s meeting our up-fuel criteria — but be sure to
only add names that are in leading groups, and now only add two trades per week
once again until leadership and follow-through improve (soon?).
On the short side
this year, we’ve had breakdowns from flags (one can use a down cup-and-handle
here as well) in stocks meeting our down-fuel criteria (and still open
positions) in: NONE. Continue to watch our NL list
daily and to short any stock meeting our down-fuel criteria breaking down out of
a downward flag or down cup-and-handle that is in a leading group to the
downside but only add up to two in any week (and only in the weakest groups)
until we get better breadth numbers on the downside and better leadership.
I still would say
that my best guess is that we’re base building for a “B†wave rally that will
last into early 2003 at least. Aggressive investors should consider allocating
to gold stocks and resource plays upon continuation of breakouts, as well as
looking to hedge the dollar if it makes new lows. These are strong trends that
few complete portfolios should ignore if they develop further. Regarding the
U.S. market, WE MUST LET THE MARKETS CONFIRM THAT THERE IS
ENOUGH STRENGTH TO SAFELY PARTICIPATE IN THIS RALLY. And that still
requires much stronger evidence of clear new group leadership, substantially
more breakouts of close-calls or stocks meeting our criteria, better and more
consistent follow-through by those close calls and criteria stocks that do
breakout, and substantially more breadth of new highs and breakouts on our
list. Watch and wait for opportunities to improve. Don’t forget that profits
can come VERY QUICKLY when things all line up
correctly — like the nearly 50% gain we took from the late ’99-early 2000 three
months. But patience is required to not give our big gains back in a less the
optimal period.
Until next time,
Mark