Through a Trader’s Eye
From 1990 to 1997, Kevin Haggerty served as Senior Vice President for Equity Trading at Fidelity Capital Markets, Boston, a division of Fidelity Investments. He was responsible for all U.S. institutional Listed, OTC and Option trading in addition to all major Exchange Floor Executions. For a free trial to Kevin’s Daily Trading Report, please click here.
The SPX futures were down as much as -13 points by 8:20 AM as the Shanghai index sold off again, so the major indexes opened at a significant discount with the SPX hitting 980.62 on the opening bar.
 However that proved to be the intraday low, and the SPX finished the day at 996.40 or +0.7%, on light NYSE volume of 1.03 bill shs. There was a significant increase in volume in the MOC session from 3:40-4:00 PM, from 755mm to 1.03 bill shs, so there might have been some options expiration activity ahead of Friday.
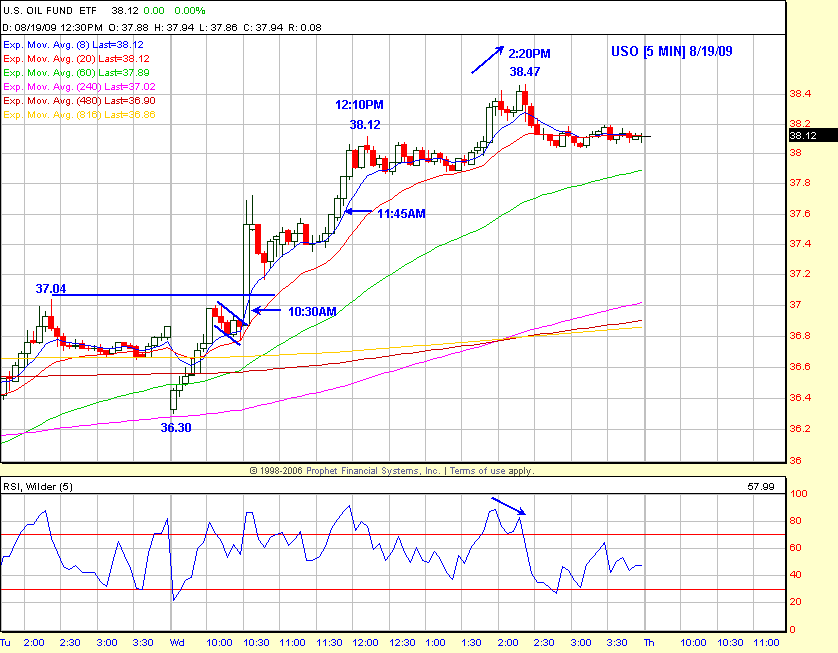
It was another day with the $US dollar down and commodities up, which is, as I have said in previous commentaries, a day trader’s goldmine. The USO reversed immediately after a relatively small discount opening and the SPX went with it. However, the OIH formed a 3 bar dynamite triangle, with the trader’s entry above 100.38, or else above the 100.47 high. This defined setup, which lagged the immediate USO and SPX reversals, was all the trader needed to get involved.

The SPX and OIH traded in concert with the USO, and there were strategy B/O’s on the 10:30 AM and 11:45 AM bars. The OIH made a 3 bar pullback to 100.70 on the 10:25 AM signal bar, with entry above 101.13 on the 10:30 AM bar, at the same time as the USO broke out of a flag pullback, and above the previous day’s 37.04 high, so the daytrader had confirmation of the trade entry.
All three had defined B/O’s on the 11:45 AM bar as the USO was driving the bus. When the USO paused on the 12:10 PM bar, so did the SPX, and OIH, and both the SPX and OIH topped out on the 1:10 PM bar, while the USO hit its high on the 2:20 PM bar. There were also many defined setups in the OIH component stocks, as you would expect.
 In addition to the immediate reversal of the USO, there were first bar reversals in FCX, FXI, EEM, XME, and GDX, so the delayed OIH 3 bar dynamite triangle setup was essentially a no brainer for daytraders in the Trading Service that know the specific strategies, and how to trade the inverse relationship of the $US dollar and commodities which has been and continues to be a major focus.
The short term market view outlined in the previous two commentaries (Market Reverses From Key Price and Time Zone and High Probability Zone and Correlation Trades) has not changed.
Have a good trading day!
Click here to find full details on Kevin’s courses including Trading with the Generals with over 20 hours of professional market strategies. And for a free trial to Kevin’s daily trading service, click here.
