Thursday’s Stock Watch
Current holiday trading has
provided few volume clues as to an institutional bias, though the
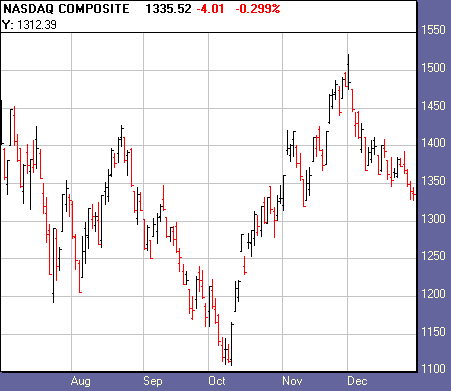
major averages’ descent below the 50-day moving averages is clearly a negative.
Global tension with Iraq and North Korea are undoubtedly contributing to a lack
of conviction for this market.
Market breadth remains stagnant, with quiet New
52-week High and Lows lists, and no clear bias from Mark Boucher‘s
Top
RS and ER List and
Bottom RS and ER List.
Stocks from our watch lists have been putting in
mixed results. We now have
(
APOL |
Quote |
Chart |
News |
PowerRating) in a cup-and-handle as it refuses to accept the
bear market. This is exactly what we’d like to see more of in the near future.
Until then, it remains a waiting game for intermediate-term traders. This
strategy is designed to capture high growth stocks primed for bull markets,
though can always be used as a measure of the overall market. We’re heading into
a New Year now, and hope to be adding new names for successful breakouts.
From Tuesday’s action:
Market breadth was positive, with NYSE
advancing issues over declining issues by a ratio of 1.75, and up volume over
down volume by a 1.58 ratio. Nasdaq advancing issues over declining issues came
in at 1.37, and up volume beat down volume by a 1.13 ratio.
Dow Jones Industrial Average
(
$INDU.X |
Quote |
Chart |
News |
PowerRating)
closed +0.10%
at 8,341.63. The S&P 500
(
$SPX.X |
Quote |
Chart |
News |
PowerRating)
closed +0.04% at
879.82.
The Nasdaq
(
$COMPQ |
Quote |
Chart |
News |
PowerRating) closed -0.30% at
1,335.50.

1,924
1,992
Declining Issues
1,111
1,455
618,604,000
575,303,000
410,397,000
536,915,000
Total
Volume
1,051,637,000
1,152,937,000
Highs
6
7
4
3
Top sectors:
Gold, Defense, Consumer, Defensive.
Watch List Action:
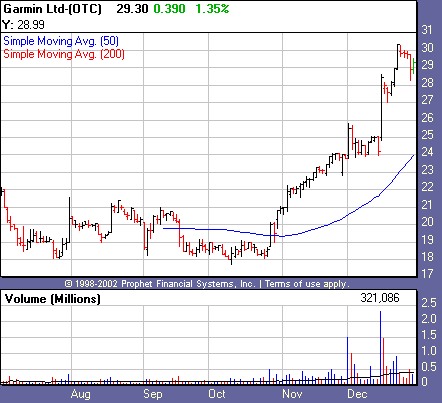
Now in pullback mode, Garmin Ltd
(
GRMN |
Quote |
Chart |
News |
PowerRating) gave us a day of distribution
Thursday, though is still looking good as it trades well above its major moving
averages. It would be ideal to see down volume dry up in here. We have seen the
daily average volume on this stock nearly double since it first came on the
report, a good sign going forward.

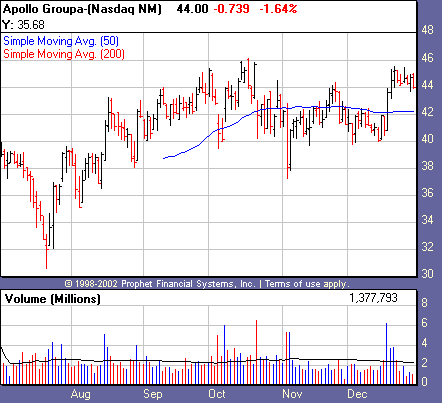
Now in cup-and-handle mode, Apollo Group
(
APOL |
Quote |
Chart |
News |
PowerRating) is looking poised for
a nice breakout. Accumulation evident on the right side of the base bodes well
for the prospects of a successful breakout, though a stronger market would make
for better circumstances. The weekly chart on this one shows a stock that has
refused to accept the bear market.

Recent Breakouts
size=2>We monitor the action of Recent Breakouts as an indicator of
the market health for IT traders. When breakouts are acting well, this is a good
sign for the likelihood of further sustainable breakouts. When breakouts are
failing, IT traders should be even more cautious.
| color=#ffffff size=2>Company Name | color=#ffffff size=2>Symbol | color=#ffffff size=2>12 Month RS | color=#ffffff size=2>Price | color=#ffffff size=2>Price Change | color=#ffffff size=2>Average Volume | Pivot | 52-Week High |
Coach Inc. | ( COH | Quote | Chart | News | PowerRating) | 94 | 32.92 | -0.04 | 901,600 | 29.80 | 35.70 |
Garmin Ltd. | ( GRMN | Quote | Chart | News | PowerRating) | 95 | 29.30 | +0.39 | 351,700 | 23.46 | 28.98 |
Hovnanian Enterprises | ( HOV | Quote | Chart | News | PowerRating) | 78 | 31.70 | -0.08 | 666,200 | 33.56 | 40.56 |
International Game Technology | ( IGT | Quote | Chart | News | PowerRating) | 87 | 75.92 | +0.76 | 998,100 | 66.70 | 80.10 |
Stocks Forming a Handle
| color=#ffffff size=2>Company Name | color=#ffffff size=2>Symbol | color=#ffffff size=2>12 Month RS | color=#ffffff size=2>Price | color=#ffffff size=2>Price Change | color=#ffffff size=2>Average Volume | Pivot |
Expedia | ( EXPE | Quote | Chart | News | PowerRating) | 94 | 66.93 | +0.12 | 2,854,400 | 78.72 |
Ross Stores Inc. | ( ROST | Quote | Chart | News | PowerRating) | 87 | 42.39 | +0.49 | 1,075,200 | 47.34 |
We will be taking ROST off the list due to
distribution and sloppy price action below its 50-day moving average.
Stocks Building A Base
color=#ffffff size=2>Company Name | color=#ffffff size=2>Symbol | color=#ffffff size=2>12 Month RS | color=#ffffff size=2>Price | color=#ffffff size=2>Price Change | color=#ffffff size=2>Average Volume | Pivot |
Apollo Group | ( APOL | Quote | Chart | News | PowerRating) | 87 | 44.00 | -0.74 | 2,494,900 | 44.46 |
APOL will be moving to our “handle” list.
href=”mailto:danielb@tradingmarkets.com”>danielb@tradingmarkets.com
If you are new to the “IT” strategy, be sure to
take a look at our
intermediate-term online trading course.
Intermediate-Term Traders
Report is posted on
Tuesdays and Fridays. For other intermediate-term commentary, be sure to read
Mark Boucher (Fridays),
Tim Truebenbach (Tuesdays and Thursdays), and
Gary Kaltbaum (Mondays and Thursdays).
