To Buy or Not to Buy
From 1990 to 1997, Kevin Haggerty served as Senior Vice President for Equity Trading at Fidelity Capital Markets, Boston, a division of Fidelity Investments. He was responsible for all U.S. institutional Listed, OTC and Option trading in addition to all major Exchange Floor Executions. For a free trial to Kevin’s Daily Trading Report, please click here.
The previous commentary was 5/19 (click here to read), and then on 5/20 we got another Euro meltdown and the SPX finished -3.9% to 1071.59, which was the first close below the 200DEMA in this current cycle, and that was a significant technical change to the current bull cycle from the 3/6/09 667 low. It was also the second penetration of the 200EMA, so there was forced selling by market timing managers.
On 5/6 the U.S. market had a Euro meltdown that was accelerated by the “system meltdown”, which the SEC has yet to define, and the SPX made a 1065.79 intraday low, but reversed to close at 1128.15, and above the 200DEMA. The SPX continued the reversal up to the 1173.57 high on 5/13 and then reversed and so we fast forward to yesterday.
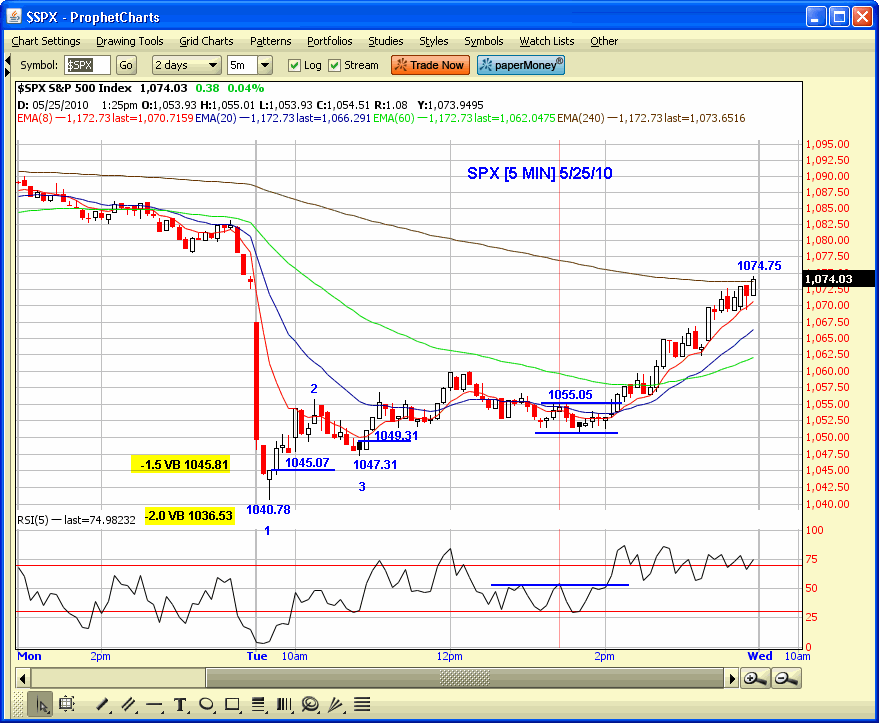
There was another foreign market meltdown yesterday, and the SPX had a significant discount opening as the SPX traded down to a 1040.78 low on the 9:40 AM bar, which took out the previous 2/5/10 1044.50 significant low. However, the world got better or should we say the PPT got active, and the market reversed and traded up to a 1074.03 close.
The price action yesterday was significant in that the SPX took out the 1044.50 2/5/10 low, but reversed it and closed above the 2/5 1067.13 high. However, the 5/20 1071.59 close below the 200DEMA has changed the complexion of this market, and now it is simply being long the SPX above the 200DEMA which is currently 1101.92 or short the market below it.
The meltdown yesterday was a bonus for day traders that understand how and when to trade extended volatility. The SPX made a 1040.78 low yesterday versus the -2.0 VB at 1036.53 and -1.5 VB at 1045.81. Traders using my Volatility Bands took the strategy entry above 1045.07, and if they missed that they had a 123 Higher Bottom opportunity above 1049.31.
The third opportunity was the contracted volatility B/O above 1055.05, which was also a Flag B/O, but it caught the “magic move” that started on the 2:05 PM bar. I suspect that there was market intervention yesterday by the PPT [plunge protection team], but it did accelerate some real buying as the drones hit their algorithm buttons, and as I complete this at 8:40 AM the SPX futures are +11.5 points. There will most likely be some initial 200DEMA resistance selling after the run from the 1040.78 low, but after that the test of whether this market can recover or not begins.
The SPX is -14.7% high to low from the 4/26 1219.80 high, at the 1229 .618RT zone to 1576 from 667, and +83% in 13 months from the 3/6/09 667 low. Since 1953 there have been 15 bull cycles, and 10 of them have topped out from plus 60-90%.
Have a good trading day!

Click here to find full details on Kevin’s courses including Trading with the Generals with over 20 hours of professional market strategies. And for a free trial to Kevin’s daily trading service, click here.
