To determine intraday major support and resistance levels, try this
Stocks wrapped up a positive week
with a quiet session of sideways trading action last Friday. Both the
S&P 500
(
SPX |
Quote |
Chart |
News |
PowerRating) and Dow Jones Industrials
(
DJX |
Quote |
Chart |
News |
PowerRating) managed nominal 0.2%
gains, but the S&P traded in a narrow range of only five points. The Nasdaq
Composite
(
COMP |
Quote |
Chart |
News |
PowerRating), S&P Midcap 400, and small-cap Russell 2000
(
RUT |
Quote |
Chart |
News |
PowerRating)
indices each closed 0.3% higher. For the week, the S&P 500 and Nasdaq Composite
each rallied two percent. The S&P also closed at a fresh five-year high on its
weekly chart, while the Dow set its highest weekly close since May of 2001.
Turnover surged across the board last Friday, but much of the
rise was likely attributed to "quadruple witching" options expiration day. Total
volume in the NYSE increased by 21%, while volume in the Nasdaq was 10% higher
than the previous day’s level. Technically, the increase in turnover gave both
exchanges a bullish "accumulation day," but higher volume during a session of
sideways consolidation is actually negative. When such action occurs after an
extended rally, it usually indicates churning that is indicative of
institutional selling into strength. More importantly, Friday’s volume surge was
largely skewed by the simultaneous expiration of both monthly and quarterly
stock and futures options contracts. This "quadruple witching" usually results
in a large increase in volume, as institutions are forced to close out various
stock positions that correspond to their options positions.
Because the S&P has closed higher for six consecutive days and
the Nasdaq continues to weigh on the broad market, a minimum of a short-term
correction within the next day or two is very likely. For short-term traders, it
is helpful to know where to expect the key support levels to be. For swing
traders who enter positions with an intended time frame of several days to a
week, the hourly intraday chart is an ideal interval for determining where the
major support and resistance levels are located.
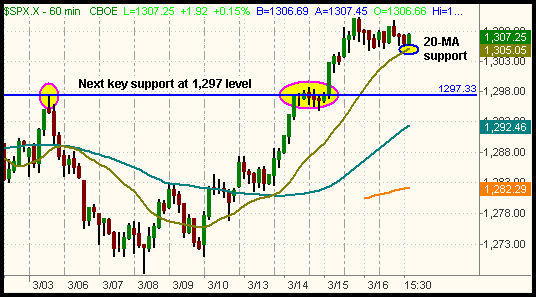
On the hourly chart of the S&P 500 below, the 20-period moving
average (brown line) correlates to support of an uptrend line that has formed
from the March 10 low. If the S&P holds above that 20-day moving average, it
could continue rallying to new highs for a while longer before correcting.
However, a break of the 20-day moving average would likely cause the S&P to fall
to the 1,297 area. That level, which is marked by the blue horizontal line,
represents support from the prior high of March 3, as well as the price
consolidation of March 14 and 15:

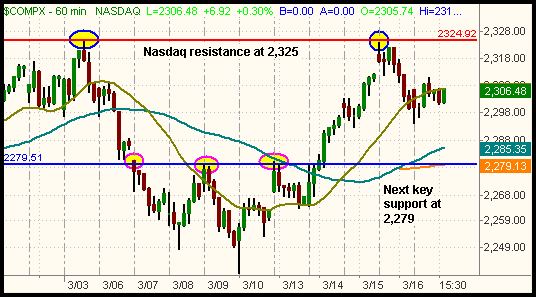
Unlike the S&P 500, which has virtually no overhead
resistance, the Nasdaq Composite ran into resistance of its March 3 high last
week. As you can see on the chart below, the Nasdaq was unable to penetrate the
2,325 level on March 15, which led to a selloff in the afternoon. Going into
this week, that 2,325 level obviously is a key area to watch. On the downside,
price support should be found at the 2,279 area:

In the bigger picture, the overall theme remains the same as
it was throughout last week. The S&P and Dow continue to act well, but weakness
in the heavily weighted Semiconductor Index
(
SOX |
Quote |
Chart |
News |
PowerRating) is holding the Nasdaq
down. With the Nasdaq showing such relative weakness, it is not likely that the
S&P and Dow can sustain their rallies much longer unless the Nasdaq gets in
gear. Obviously, that will only happen if $SOX reverses its bearish course. Over
the next several days, we will take an updated look at which sectors and ETFs
are showing the best chart patterns for short and long entries, but we first
want to see the extent of the broad market’s retracement when it begins to
correct. Until then, consider tightening stops on any long positions in order to
protect your profits in the face of a weak Nasdaq.
Open ETF positions:
Short IGW (regular subscribers to
The Wagner Daily
receive detailed stop and target prices on open positions and detailed setup
information on new ETF trade entry prices. Intraday e-mail alerts are also sent
as needed.)
Deron Wagner is the head trader of Morpheus Capital Hedge Fund and founder of
Morpheus Trading Group (morpheustrading.com),
which he launched in 2001. Wagner appears on his best-selling video, Sector
Trading Strategies (Marketplace Books, June 2002), and is co-author of both The
Long-Term Day Trader (Career Press, April 2000) and The After-Hours Trader
(McGraw Hill, August 2000). Past television appearances include CNBC, ABC, and
Yahoo! FinanceVision. He is also a frequent guest speaker at various trading and
financial conferences around the world. For a free trial to the full version of
The Wagner Daily or to learn about Deron’s other services, visit
morpheustrading.com or send an e-mail to
deron@morpheustrading.com .
