Today, Watch This Right Shoulder Formation
Stock index futures opened Tuesday’s session with small
downside gaps, mainly due to the strength of the U.S. dollar.
An oscillation range was to be expected after Monday’s move, which is what we
got throughout the morning. Around 11 am ET, the dollar broke through its daily
resistance and triggered a sell-off in the futures to print a new session low.
The futures recovered enough for a test of the day’s high, but another thrust up
by the dollar led to another sharp move down to crack a new low. The slide was
also helped Fed Chair Greenspan poking a needle into the bubble of common sense
by stating that the Fed would have to eventually raise rates. The lunchtime
period was spent stair-stepping down until the contract found support at
Monday’s session low. The dollar’s stall at its 100-day MA prompted some
short-covering back up to the midpoint of the range, but once that was done, the
futures fizzled out again.
The March SP 500 futures closed
Tuesday’s session with a loss of -6.50 points, and finished in the lower 1/2 of
its daily range. Volume in the ES was estimated at 588,000 contracts, which was
ahead of Monday’s pace, and right at the daily average. Monday’s move prompted
a rise in open interest in the ES, but a decrease in the SPH. This could be
interpreted as new retail money buying into the up move, while the “smart money”
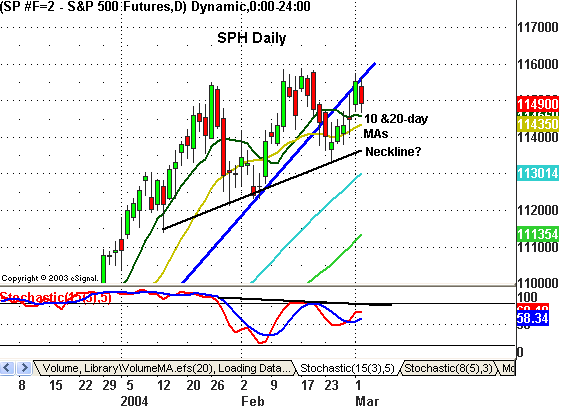
used the rise to book profits. Looking at the daily chart, the ES posted a
market structure high and continues to be pinned by its broken trend line on the
upside. With today’s weakness, I’m sure everyone and their brother is watching
the formation of a right shoulder on a head-and-shoulders pattern with a
neckline in the 1140 area. On an intraday basis, the 30-min Butterfly pattern
hit its 1st target of 1149, but was held up by the 60-min trend line.

The Banking Index (BKX) posted
a market structure high and gave us a normal pullback to its broken triangle
trend line. The Dollar Index (DXC) rattled both the equity and bond markets with
a technical breakout and settled right at its descending 100-day MA. A normal
pullback would be to its breakout area at 88.
Wednesday morning gives us
February ISM Services at 10 am ET, and its estimate for 63.0. The Fed Beige Book
will also be released at 2 pm, but I wouldn’t expect much reaction off of old
news. As the week goes on, we may see continued pressure as speculation builds
that Friday’s Employment numbers may be the catalyst for a rate hike sooner
rather than later. Personally, I think the report is gonna be a lose-lose
situation because a strong number will stoke more rate hike fears, while a weak
number will prompt the worry-warts that the economic recovery is stalling.


Please feel free to email me with any questions
you might have and have a great trading day tomorrow!
