Today’s Reference Points
What Monday’s Action Tells You
The major indices opened down taking out the
lower trading range boundary and then there was a late mark-up into the late SPX
close of 1043.63 just above the actual range low of 1043.46, but below the low
close of 1046.57. After making a 1035.28 intraday low, the SPX did manage to
close above the midpoint, but that means little when you have a volume ratio of
just 18 and breadth of -1300. NYSE volume was 1.33 billion. In the major
sectors, the brokers (XBD) gave up -1.8% while the SMH, RTH, and CYC were all
-1%. Both the SPX and Dow each declined 0.6% while the Nasdaq and QQQs were
-1.1%. This corner sold those SMH puts as the SMH hit an intraday low of 41.22
before closing at 41.90 versus its 20-day EMA of 41.95. The confluence of four
numbers above the 44 level has pushed the SMHs back -7.8% from the 44.70 high
six days ago
(see Nov 4 commentary).
In addition to the SPX, the Dow also re-crossed
its 50-day EMA of 9645 after an intaday low of 9630. The QQQ made an intraday
low of 34.26, then recrossed its 50-day EMA of 34.47, closing at 34.66. The
QQQ volume is significant yesterday at 108 million vs. 102 million on 10/24,
the first retracement to the 50-day day EMA and 119 million on the 9/30 retracement
to the 50-day EMA. Each time there was a reflex up following the volume spike.
| size=2>Â |
Tuesday
11/11 |
Wednesday
11/12 |
Thursday
11/13 |
Friday
11/14 |
Monday
11/17 |
| color=#0000ff>Index | Â | Â | Â | Â | Â |
| color=#0000ff>SPX | Â | Â | Â | Â | Â |
| color=#0000ff>High |
1048.23
|
1059.10
|
1059.62
|
1063.65
|
1050.35
|
| color=#0000ff>Low |
1043.46
|
1046.57
|
1052.96
|
1048.11
|
1035.28
|
| color=#0000ff>Close |
1046.57
|
1058.53
|
1058.41
|
1050.35
|
1043.63
|
| color=#0000ff>% |
-.05
|
+1.1
|
0
|
-0.8
|
-0.6
|
| color=#0000ff>Range |
5
|
12.5
|
6.7
|
15.5
|
15.1
|
| color=#0000ff>% Range |
62
|
95
|
81
|
14
|
55
|
| color=#0000ff>INDU |
9738
|
9849
|
9838
|
9769
|
9711
|
| color=#0000ff>% |
-0.2
|
+1.1
|
-0.1
|
-0.7
|
-0.6
|
| color=#0000ff>NASDAQ |
1931
|
1973
|
1967
|
1930
|
1910
|
| color=#0000ff>% |
-0.6
|
+2.2
|
-0.3
|
-1.9
|
-1.1
|
| color=#0000ff>QQQ |
35.08
|
35.84
|
35.78
|
35.03
|
34.65
|
| color=#0000ff>% |
-0.3
|
+2.2
|
-.08
|
-2.1
|
-1.1
|
| color=#0000ff>NYSE | |||||
| color=#0000ff>T. VOL |
1.16
|
1.33
|
1.36
|
1.34
|
1.33
|
| color=#0000ff>U. VOL |
426
|
1.10
|
689
|
455
|
236
|
| color=#0000ff>D. VOL |
710
|
205
|
655
|
871
|
1.06
|
| color=#0000ff>VR |
37
|
84
|
51
|
34
|
18
|
| color=#0000ff>4 MA |
45
|
50
|
50
|
51
|
47
|
| color=#0000ff>5 RSI |
41
|
65
|
65
|
46
|
36
|
| color=#0000ff>ADV |
1308
|
2454
|
1861
|
1344
|
976
|
| color=#0000ff>DEC |
1916
|
814
|
1394
|
1884
|
2276
|
| color=#0000ff>A-D |
-608
|
+1640
|
+467
|
-540
|
-1300
|
| color=#0000ff>4 MA |
-184
|
+90
|
+204
|
+240
|
+67
|
| color=#0000ff>SECTORS |
-3.4
| ||||
| color=#0000ff>SMH |
+0.3
|
+3.6
|
-2.0
|
-1.1
|
-1.0
|
| color=#0000ff>BKX |
-.09
|
+0.3
|
-0.1
|
-4.1
|
-0.3
|
| color=#0000ff>XBD |
-0.6
|
+1.1
|
+0.1
|
-0.6
|
-1.8
|
| color=#0000ff>RTH |
+0.3
|
+0.3
|
-1.6
|
-0.9
|
-1.0
|
| color=#0000ff>CYC |
-0.2
|
+1.4
|
-.03
|
+1.9
|
-1.0
|
| color=#0000ff>PPH |
+0.3
|
+1.8
|
+2.9
|
+6.2
|
-0.6
|
| color=#0000ff>OIH |
-.05
|
+0.6
|
+2.0
|
+0.5
|
-1.9
|
| color=#0000ff>BBH |
-0.3
|
+2.3
|
+1.4
|
-2.0
|
+0.9
|
| color=#0000ff>TLT |
0
|
+0.7
|
+1.6
|
+0.7
|
+0.2
|
| color=#0000ff>XAU |
+0.3
|
+5.6
|
-0.6
|
+0.9
|
-2.1
|
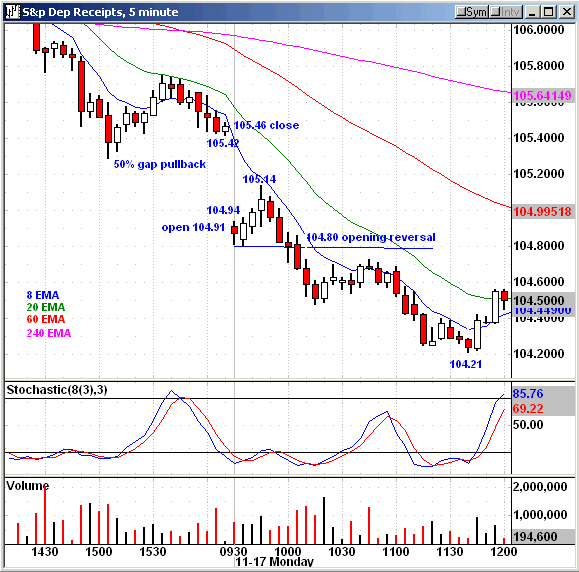
The SPY gapped down on the open at 104.91 from
the previous close of 105.46. It made a three-bar contra-move retracement, which
was the 50% gap pullback, then resumed the direction of the open, and gave you
the opening reversal (OR) trade with entry below the first bar low of 104.80
which is also the recent trading range low. The SPY traded down to 104.21 on
the 11:40 AM bar, then went sideways after a little bump up. Traders familiar
with the RST strategy and volatility bands also caught the afternoon trend in
the SPY or futures as the RST entry on the SPY was above 104.20, which was the
high of the 1:20 PM RST signal bar (not shown on chart). There was a strong
confluence, as the SPX had declined to its 2.0 volatility band level, which
was 1034.75 with the intraday low at 1035.28 on the 1:20 PM bar. Also, the 50-day
EMA is 1035.12 and the .618 retracement to 1018.32 is 1035.63, so there was
more than enough confluence to get your attention.
If you are familiar with my strategies, both the
downtrend and afternoon uptrend trades were clearly defined entries — exactly
how you have been taught
the strategies. The SPY traded up to 105.04 after the RST entry, closing at
104.94.
For Active Traders
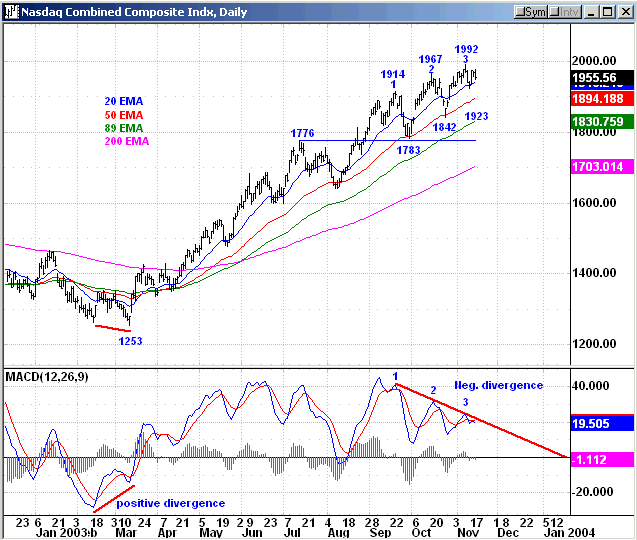
We start Tuesday with the 50-day EMA
psychological pivots for the major indices just below the closing prices, so
there is a reference point. If you check your daily charts, you will see that
the 20-day EMAs are also just below the closing prices for the major indices and
QQQs. In addition, there are the trading range lower boundaries, which for the
SPX is the 1043.46 low and 1046.57 low close. The SPX 20-day EMA is 1047.52.
The only thing the moving averages mean to me
except to identify price and trend is that the 20-, 50- and 200-day EMAs are the
most closely watched moving averages by traders and investors alike, but more
importantly, by many other wanna-be’s that don’t have a clue and think a line
means more than just a psychological level. Fact is, things happen around these
three moving averages so they deserve attention, certainly since the last three
successful retracements prior to this one have been to the 50-day EMA, two of
which, 8/5 and 9/30, traded through the downside then crossed above, but those
sequences were four and five days to complete the cross and re-cross. The last
one, on 10/24, was a one-day cross and re-cross. I point this out to emphasize
that the 50-day EMA is not an absolute and the action around it will differ each
time price approaches it.
For Today
Yesterday’s decline to the 50-day EMA was just a 2-day air pocket from 1063.65
on Friday to a 1035.28 low yesterday while the previous two were 7-8 day
retracements to a short-term oversold condition and the retracement in August
was the fourth leg of this rally off the March lows and also short-term
oversold. This drop to the 50-day EMA has the 5-day RSI at 36, but is not
short-term oversold as evident by the volume ratio, breadth or time.
On your 60-minute chart, there is a nine-bar
cluster of price resistance between 1044-1048 (rounded off) which is the lower
trading range boundary. The next cluster starts at 1054 to 1059 (using closes to
outline resistance, not lows and highs).
Daytraders have more than a few good reference
points today to work against.
Have a good trading day.
Kevin Haggerty


Â
Â
Â
