Today’s Trading Lesson From TradingMarkets
Editor’s Note:
Each night we feature a different lesson from
TM University. I hope you enjoy and profit from these.
E-mail me if you have
any questions.
Brice
Here is an edited
transcript of a recent TraderTalk interview with David Floyd in which he and
former TM Editor-in-Chief Eddie Kwong discuss how David’s Floyd Numbers are used
to identify high-probability reversals.
Brice Wightman: Good afternoon and welcome to
TraderTalk. This afternoon, we are fortunate to have with us high-velocity
trader David Floyd. David is also the mastermind of “The Floyd Numbers.”
Interviewing him today is TM Editor-in-Chief Eddie Kwong.
Click here to view the charts for today’s session.
Eddie Kwong:
Hi Dave. How are you?
David Floyd:
Very well Eddie.
Kwong: Well,
I have a few things to ask you about the current market, but I’ll save that for
later. Let’s just back up a little and look at the big picture.
Floyd:
Sure.
Kwong:
Naturally, the markets have changed dramatically over the past two years. The
go-go days are behind us. Has your approach changed, and if so, how?
Floyd:
It has changed. I have gone back to being
far more selective on my entries. In the go-go days, you could be a bit sloppy
and still get rewarded. Those days are gone. As a result, the number of trades I
take is lower, but I have increased my share size. My skills are even more
refined. My style remains the same, however, buying pullbacks and shorting
rallies off a 1-min chart.
Kwong: That
style goes back a number of years I understand. When did you get started?
Floyd:
1994. I was fresh off a bond trading desk
and was ready to tear up the equity world.
Kwong:
That was a different kind of environment
from the one in which many newcomers were exposed to in the late 90s. You
probably
learned to operate
with a lower volatility and smaller intraday ranges back then, huh?
Floyd:
Ironically, it was similar to what we
have now, perhaps not as subdued, but in retrospect it was a great environment
to learn in, it forced you to trade with a plan. And yes, the ranges were
smaller that in the late 90s.
Kwong: You
learned in a tough environment and therefore you can more readily deal with the
current tough environment.
Floyd:
I believe that is correct. There are
subtle differences now though; it is a bit more challenging.
Kwong: A lot
of traders who have entered this market within the last year or so don’t have it
as easy as we all did in the late 90s. Any advice?
Floyd:
Yes, do not give up. Contrary to what
many say, you can make a living as a trader. It takes a lot of work and
discipline. I have a guy who trades with me… he is less than a year into this
and is making excellent progress. With the right attitude, learning and
environment, it can be done. In fact… this is probably a great time for new
traders to develop the discipline necessary to be a trader, so that when
volatility comes back a bit more, it will seem much easier.
Kwong:
Let’s talk a bit about the Floyd Numbers.
I understand that they are one of your primary tools.
What are they and how
do you use them?
Floyd:
Sure, yes that as well as the KTNs I use
for the S&P and Nasdaq futures….
Kwong: Those
are numbers in your column — the KTNs?
Floyd:
Yes, the KTNs are in my
morning column. So, at any rate…I use the Floyd Numbers (FNs) as a way to
identify really above-average setups intraday.
Kwong:
When you say that you started out reading
the tape, I presume you were just watching quotes go across the wires?
Floyd:
More or less, actually watching time and
sales, counting the number of shares hitting the bid or traded on the offer.
Surprisingly, just that alone is very effective but when you combine technicals,
it becomes far more effective.
Kwong: So in
doing this, you’re able to develop a sense of which price levels were the most
KEY during the course of the day. Tell me how the FNs differ from just ordinary
support/resistance…Fib…trendlines, etc.
Floyd:
^next^
Sure. Frankly, they have come about
simply by looking at so many charts over the years, that you begin to get a
sense of what works and what doesn’t…
Kwong:
I see. But the main thing is….
Floyd:
It is a combination of a few technical
disciplines.
Kwong: The
FNs are price levels which you believe have a much greater-than-normal
probability of producing a good trading opportunity…correct?
Floyd:
Yes, provided that a trade setup exists
already, let me explain…
Kwong:
Yes…walk us through some trades.
Floyd:
The numbers themselves may not be an
absolute support resistance in and of themselves. However, if you are sitting
there trading, let’s say Applied Materials (AMAT),
because I have an example of that one (see chart below) and you are considering
going long anyways, based on your analysis, and you also see that a FN
corresponds with your entry point, you should consider that trade to be above
average. Essentially you have one other reason that the trade should pan out.
Kwong: Do
you position yourself bigger? Play it more aggressively?
Floyd: Absolutely, or better yet, let’s say
it is a trade that bucks the trend, a trade I normally never take…
Kwong:
Very
interesting on AMAT…I see.
Floyd:
This is a one-minute chart of
Applied Materials (AMAT)
from the gap down session on Wednesday, June 26., 2002.
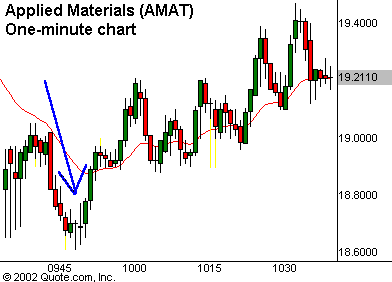
This blue arrow is on
loan from Dave Landry, and it clearly shows that the trend is down. Not exactly
the type of chart that gets you really excited to be a buyer…or is it?
On the surface it appears that looking to
go long AMAT, other than on a whim, would be
crazy. It is clearly trending down, and as is seen, there are no valid reasons
for a long setup.
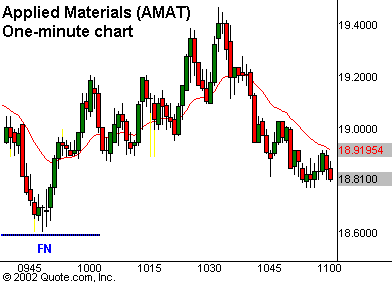
Floyd Number
(FN) at 18.62. With the Nasdaq and S&P
futures firming after the big gap down, the trade was pretty low risk, if you
used a protective stop. Normally, without the knowledge of that support level,
it would have appeared as though you were trying to pick a bottom. In this case,
you were making an educated bet.
In that case, I actually may take the trade but reduce my share size, now you
have a situation where you are in a trade that normally you would have passed
up.
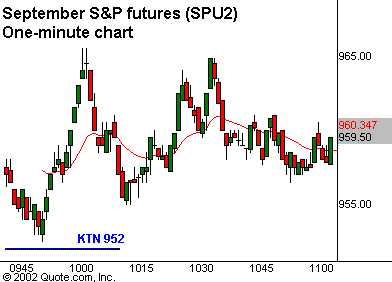
Â
^next^
Kwong:
You had both FN and a
KTN hitting simultaneously. The FN hit the stock. The KTN hit the futures?
Floyd:
Exactly. What more do you want for a
setup? Belly up and place the trade.
Kwong:
So you have both AMAT and the S&P futures sitting at
support in a market (Wednesday) that got crushed on the opening….
Floyd: Not only do you believe there will be a
reversal, based on what you are seeing in terms of price action, but now you
have a KTN and a FN letting you know there is additional support… worst-case
scenario you get stopped out, but the risk- reward is too juicy to pass up
Kwong:
Looks potent.
So walk me through…you’re sitting there at your monitor. You have your FNs
(for stocks) and your KTNs (for futures) and you’re watching the price action.
The bar unfold minute by minute… price comes down to your FN level. What’s
next?
Floyd:
Sure, take a look at these two charts, it
gives you a good way to implement these on your charts. Then I will walk you
through. The first chart,
Brocade Communications (BRCD),
shows you an effective way to utilize the FNs by simply drawing them into your
existing 1- or 5-minute chart. This puts the numbers right into the price
action, allowing you to easily see setups.
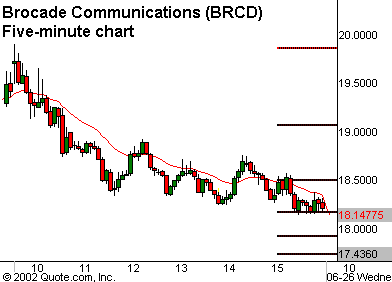
What I do to make using
the FNs easier is to actually draw them on my 1- and 5-minute charts. In this
case, you would extend the lines out to the right so that they will be present
when tomorrow’s prices populate that chart. The next chart will show the
continuation of June 26, 2002, trading. I also color the lines so that I know
the significance of each one.
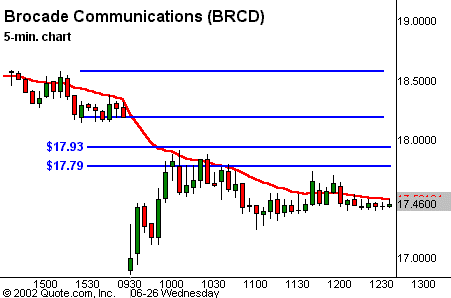
So in this case, we have
levels that present us with potential entry points, either on the short side or
long side depending on the overall price action, as well as the futures. In this
case, the Nasdaq futures also hit resistance (KTN) and sold off hard, giving you
the opportunity to short BRCD.
However, factor in a FN
on the second chart as well as looking at the S&P futures (sitting on support,
KTN), and suddenly what was once a crappy
setup becomes a trade that offers potential upside with limited risk, assuming
you use a protective stop. That is the power of using FNs, as well as
integrating the futures and their respective KTNs
to come up with a powerful combination.
Notice how I drew the FNs on to my
chart, now they are right in the middle of the price action for easy reference.
Kwong:
Right.
Floyd:
Getting back to your question…
Kwong: Will
you trade, say…a less potent situation — like if you see a FN along with a
good price pattern, but no corresponding KTN in the S&Ps?
Floyd:
Absolutely
Kwong:
But if you are looking for the “homeruns”…
Floyd:
I’ll even trade without either a FN or KTN
Kwong:
If you are looking for high-probability…
Floyd:
Yes, correct, the confluence of those one or two items gives you the extra
edge.
Kwong:
You’re looking for the sweet-spot combo of pattern, FN,
KTN, etc.
Floyd:
You got it.
That goes back to how you can adapt in
this market.
Kwong:
In what sense?
Floyd:
On days when you come across these setups, you need to step up, simply because
the price action is not what it used to be. By varying my share size on a per
trade basis, I capitalize more so when the trades are above average rather that
constantly trading the same share size. That is how you outperform the market.
Kwong:
So these days…you
get fewer setups, but you know exactly which ones offer the good risk/reward and
you know when to step in heavily…
Floyd:
Yes, 100% correct
Kwong:
OK, let me just ask you to walk us through the
Veritas (VRTS)
chart. What’s happened there and what was your plan of attack?
Floyd:
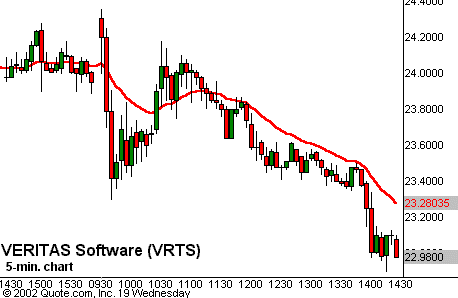
On the two charts below, again, at first glance, a long setup seems
unreasonable. However, once the FN is factored in, the trade seems more logical.
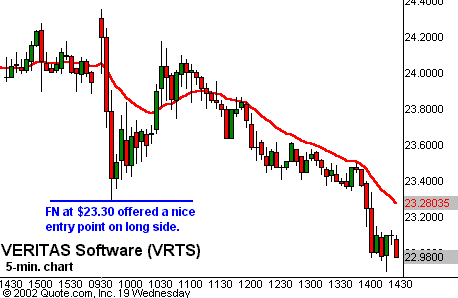
Floyd:
You always need to be adapting, I was not doing this type of varied bet size
just two years ago. In this case
you have a situation where it looks like you are catching knife, picking a
bottom etc., but in actuality you
are playing the odds again, support at an extremely oversold level… on this
trade I would have taken it, but in this case lowered my share size since I am
fighting the trend. With out that number (FN) I never would have taken the
trade. That was how I traded before using these FNs.
Kwong: I
guess the one temptation we have is to view FNs as a stand-alone, but you’re not
saying that, correct?
Floyd:
Correct, sure sometimes they work, but like anything you need further
evidence. Use them in conjunction but only with your daytrade setups but also
swing trade setups as well
Kwong:
OK, before we open it to questions.
I realize that it’s dangerous to have an
opinion — or at least a strong one — but what are your thoughts on the current
environment as it relates to trading?
Floyd:
Mixed… I actually think it has been a great year so far, better than last, at
least for me. However, my concern is further erosion of investor confidence.
That could really put a lid on volatility and that would be very bad…. we will
just have to see, in the meantime take full advantage.
Kwong:
Agreed… still, the short-term trader doesn’t trade
because he’s confident in a company.
He’s just seizing upon a few slivers of
price action.
Floyd:
Sure, but without large institutional participation, the price action just won’t
be there. It will be like summer trading but perhaps slower.
Kwong:
Right, you need the public investor.
Wightman:
Got a couple of questions here for you, David:
Do you use margin?
Floyd: Yes, in fact it is a great tool. The
concept is the same as trading off of an FN. If the trade is good, I want as
many shares as I can get that will not present a problem from a liquidity
standpoint, meaning if the stock
has only traded 100,000 all day, I do not want to try to scalp 10,000 shares. My
fills will be horrible.
Wightman:
Do you have a rule to determine position size?
Floyd:
It is subjective, and quite frankly you learn to determine what you can and
cannot “move” with a stock, Citigroup for example I can move up to 10,000 shares
and not really cause much of a problem. However, a stock like IBM, moving even
1000 shares sometimes is tough, not because there is not volume, but because of
the way the Specialist trades the stock.
Wightman:
How many times do you add to a winner?
Floyd:
Rarely. I usually go full force on my first entry. I have that conviction,
given my trades are short-term in nature (<5-min.) I do not have the luxury of
adding… I am confident to go all-out the first time. Sometimes, if I miss my
entry point though, and I feel the trade will be a good one, I will pay up
Wightman:
I’m taking a trial to your service. What’s the best way
for me to use it?
Floyd:
First off, don’t be overwhelmed by the number of FNs I put in for each stock.
Remember, these are potential areas, your number one objective should be to
identify when these FNs correspond with an existing trade setup you have already
identified, and then adjust you size accordingly. This simple act alone will
make you a far more effective trader. Frankly, of the six to eight numbers I put
on each stock each night, only one or two pan out the next day, but that is all
you need.
Wightman:
Is there a way to program FN and KTN formulas
into TradeStation?
Floyd:
Currently, no. However, that is the most effective way to use them, having them
on your screen… Unfortunately, many of the numbers are derived the
old-fashioned way, eyeballing charts. The other could be programmed in… we
will have to come up with a way to upload the numbers to a quote vendor server
so they can be overlaid on your charts.
In the meantime…..simply draw the
numbers on to your 1- and 5-minute chart.
Wightman:
David, how often do you use bullets during the day?
Floyd:
I use bullets just about every day, or I may have a conversion on, if I am
trading the same stock every day.
Wightman: What
does your service consist of and what time is it updated each night?
Floyd:
The service consists of roughly 20 stocks, 10 NYSE and 10 Nasdaq,
naturally the most active ones… And what I do is provide a range, up to 10
numbers that may offer support or resistance the following day.
I cannot stress enough the importance of
drawing them into your charts. They are usually updated by about 8:00 PM or 9:00
PM EST, and the same time on Sunday for Monday numbers. Also, it has additional
information and commentary on certain stocks that present swing trades or
unusually good setups.
Wightman:
That’s all the questions we have, Dave. Thanks. I’m
handing it back over to Eddie. Eddie?
Kwong:
OK, well, it’s been a pleasure talking with you today,
Dave. I learned a lot. Best of luck with your trading. I’ll be watching the
Floyd Numbers tomorrow for sure. Have a nice evening everybody.
Wightman:
Here’s the link to David’s service.
Try a free trial.
Have a nice evening everybody, and thanks
again.
https://www.tradingsubscriptions.com/subscriptions/site.cfm?page=sub-flyd-1.
Floyd:
Thanks, Brice and Eddie.
