Today’s Trading Lesson From TradingMarkets
Editor’s Note:
Each night we feature a different lesson from
TM University. I hope you enjoy and profit from these.
E-mail me if you have any
questions.
Brice
Sentiment
Indicators I Could Not Live Without
This is a
follow-up to an
earlier piece about some of the sentiment indicators that I
watch. These are contrarian indicators, meaning if they flash too much
bearishness, it may be time to go the other way. Now it is imperative to
remember that regardless of these indicators, for me, market action will always
take center stage. Sentiment is secondary to my work but has to be watched
especially when the numbers hit extremes. I will start getting real excited with
powerful stock market action.
What have some of these indicators flashed recently?
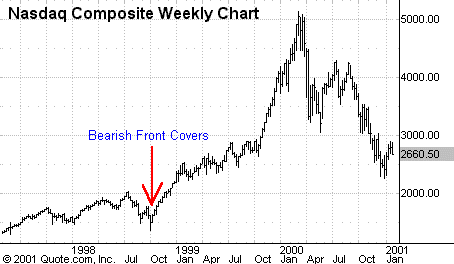
Front Cover Indicator: Back at the ’98 lows,
Newsweek, Time, Fortune, Forbes and even Esquire
had front covers depicting crashes and bears. Of course, this happened after the
drop. These magazines are notorious in reporting the news loudly after the move
has already been made. Pictures of bears and declining charts in Newsweek,
Time, U.S. News, and The Economist get me wondering:
Could they have called the low for the cycle again? Hmm…


Â
Put/Call Ratio: During good times, people are optimistic. In such
times, more often than not, investors are buying calls…betting on higher
prices. But what happens when investors are panicky? They buy puts. When the
ratio of trading volume in puts vs. calls hits above 1.0, it is considered
extreme pessimism and can possibly signal a turn in the market in the near-term.
Put/Call Ratios can spike to extreme numbers on
really bad days as investors bet on lower prices after
the drop. Hmm…another notch in the bull’s belt.
VIX/VXN: You may have seen my occassional
references to certain volatility measurements. These two numbers can also go to
extremes during panic days. In layman’s terms, they measure the tone of the
selling, which, to say the least, can get panicky at the lows. The VIX on such
occasions can move above 40,a number believed to be extreme. When the VXN moves
above 80, I would say the VXN as a contrary indicator has turned green.
ARMS Index: Many people call this the “perfect indicator” because it
so rarely signals, and only with extremes. An extreme number of 1.5 has only
been hit on several occasions. The last few — Sept. 3, 1981; Aug. 2, 1982; Oct.
16, 1987; Nov. 30, 1987; Oct. 27, 1987; and (drum roll, please) March 16, 2001.
I use this as another measurement of panic and volatility in looking for the
lows.
The things you hear every day: Yes, this is
one of my favorites. Back at the lows in 98,I was listening to rumors of
Banker’s Trust and Lehman Brothers filing bankruptcy. I was listening to the
supposed destruction of the finance system because of a hedge fund. Russia and
Mexico imploding. Get the hint. Think about what kind of talk you have heard at
tops. Conversely, what have you heard at lows? Depression, recession, the next
Japan, layoffs, bankruptcies, analyst downgrades, lowered estimates, no
visibility, stagflation. I don’t remember ever hearing this type of talk at the
highs, only the lows.
All in all, just some more ammunition for your investing. When sentiment numbers
go to extremes, it is like an alarm bell for me.
Â
