Today’s Trading Lesson From TradingMarkets
Editor’s Note:
Each night we feature a different lesson from
TM University. I hope you enjoy and profit from these.
E-mail me if you have any
questions.
Brice
Leadership Rotates…So Rotate With It!
By Tsutae Kamada
Â
Which is the best baseball team today? I believe many baseball fans
would pick the New York Yankees. As we know, the Yankees recently captured their
third straight World Series title. When a team is in a winning streak, it’s
almost unstoppable. Winning streaks are like strong uptrending stock sectors,
and their trends last a long time. We can say the same of downtrending sectors.
Once a sector begins a downtrend, it tends to remain in the downtrend for a long
time.
We often hear investors talk about “sector rotation.” Why is it so
important to pay attention to stock sectors? In general, when mutual funds
invest their money, their decisions are based on economic forecasts. Analysts
are constantly looking for which sectors or industries will benefit from
upcoming economic environments. If fund managers see the semiconductor sector
looking attractive in coming months, they will shift or rotate money from weak
sectors to semiconductors. Â
Back in May 1999, the
semiconductor sector began an uptrend which lasted till March 2000. We saw the
semiconductor sector index (SOX)
rise from 370 to 1360 in this period. As I mentioned earlier, once a trend
begins, it will last long time. Also in this same period, the
telecommunications sector was experiencing a strong bull market, and its index (XTC)
ran up almost 60%. As long as business environments and economic conditions are
favorable to certain stock sectors, fund managers will not shift money to other
sectors. That’s why we keep hearing the same sectors’ names over and over as
strong performers.Â
As semiconductors and telecommunications were peaking in March 2000, one sector
slowly began to come out of its bear market — the utilities sector. Since
March, the Utility Sector Index (UTY)
climbed up from 240 to 380, almost 60%, and its uptrend is still intact. This is
one actual example of how yesterday’s loser becomes today’s hero. By reviewing
and studying each sector’s chart every day, we can see signs of technical
weakness, such as a violation of long-term trendlines which may be signaling
that a sector rotation is in progress. Also, periodically checking
TradingMarkets.com Uptrending and Downtrending Indicators can give us
valuable information about which sectors are strong or weak. Â
Let me give you two actual examples. Exchange Traded Funds (ETFs are like mutual
funds but are traded in major stock exchanges) provide us with excellent
pictures of hot and weak stock sectors. According to
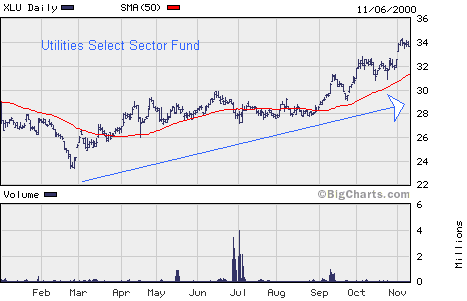
TradingMarkets.com Funds Indicators, the best 12-month performing fund at
present is the Utilities Select Sector Fund (XLU).
It has a strong three-month RS (relative strength) of 98, a six-month RS of 97,
and a 12-month RS of 96. As you can see on the daily chart, the stock has been
uptrending since February 2000 and it still looks strong.
On the other hand, the worst 12-month
fund at the moment is the Internet Holders (HHH).
It has an extremely low three-month RS of 4, a six-month RS of 1, and a 12-month
RS of 1. The issue has been declining since the beginning of 2000, and this
downtrend is still intact.Â
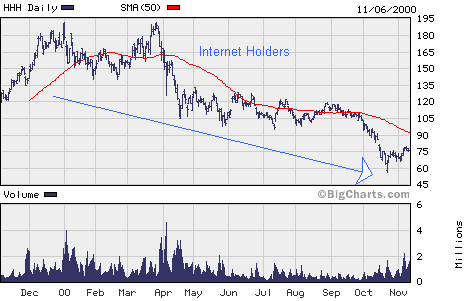
If you look at these two charts again,
you will notice how money shifts or “rotates” from a weak sector to a strong
sector. I cannot stress enough the importance of following strong sectors. Let
me add that sector funds are a wonderful way to capture long-term profits from
uptrending sectors.Â
A stock sector can be divided into several sub-sectors or industries. For
example, the utilities sector comprises three industries: electric, gas, and
water utilities. You can find profitable opportunities in the strongest and the
weakest sub-sectors, just as you can in sector funds. According to
Dow Jones & Company, the best-performing industry of 2000 is
Biotechnology (a sub-sector of the healthcare sector), up 69.84% (YTD), and
the worst is Office Equipment ( a sub-sector of the technology sector),
down 48.32% (YTD).
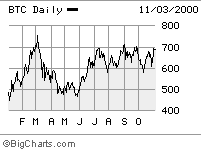
Biotechnology
Index                                       Office Equipment Index
 Â Â Â Â Â Â Â Â Â Â Â Â Â Â Â Â Â Â Â Â
                    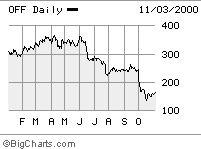
As you can see, the Biotechnology
Index is challenging its resistance level near 700, and it may be setting up for
a breakout. On the other hand, the Office Equipment Index is still in a clear
downtrend.
Our next task is picking potential buy
candidates from the Biotechnology industry and choosing issues for shorting from
the Office Equipment industry. You can find those stocks easily by utilizing our
TradingMarkets.com Stock Scanner. You can set your own criteria, but
I would like to show you how I use the scanner.Â
Let’s start with Biotechnology.Â
First, I set the Sub Sector to
Biotechnology. Usually, higher-priced stocks give you better results
because they have a wide daily price range, so I put 30 or higher into the
Closing Price section. Next, I insert “3000” (3000 equals 300,000 shares —
the last two 0s are omitted) into the 50 day avg. volume section. I want
stocks to have good liquidity. Next, I put 80 or higher into the RS(3MO)
section. If my stock has a RS of 80, that means the stock belongs to the top 20%
of the group. Lastly, I insert greater into the 50-day MA and 200-day MA
sections and hit the START SEARCH button. That’s it.
Now I have 13
biotechnology stocks as a result of this scan. These stocks are: (ABGX),
(AFFX),
(AMRI),
(AVIR),
(CELG),
(ENZN),
(GENZ),
(IDPH),
(IMCL),
(IVGN),
(MEDX),
(MYGN),
and (PDLI).Â
I study each daily chart
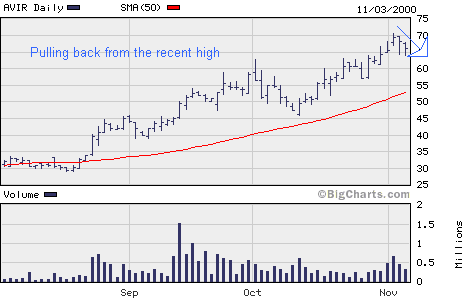
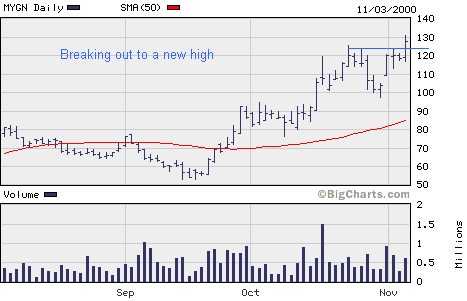
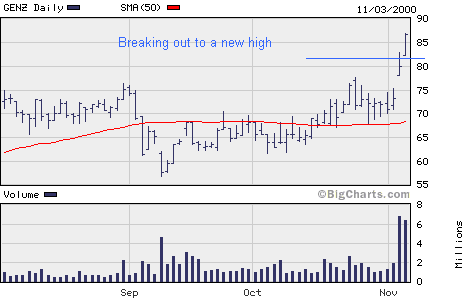
and look for stocks with excellent tradable patterns. Four stocks look
interesting to me: AMRI and AVIR are pulling back from recent highs and we can
expect them to resume their uptrend. MYGN and GENZ made strong breakouts to new
highs. Their breakout volume was big, and their upward move will probably
continue for a while.

Â
This time, I will choose
potential short-selling candidates from the Office Equipment industry, again
using
TradingMarkets.com Stock Scanner. I start by setting the Sub
Sector to Office Equipment. My scanning criteria are: Closing price
of 30 or higher; 50-day average volume of 300,000 shares or higher; ADX value of
30 or higher; Negative DMI value; and closing price of below 50-day moving
average. (You can study more on ADX indicator in Dave Landry’s
Finding The Strongest Trends With ADX.)Â
In general, the higher
the ADX value, the stronger the trend of the stock. This time, my scan produced
no potential short-selling stocks. I decided to remove closing price and 50-day
average restrictions but this still did not give me any stocks. My conclusion is
that although this industry is downtrending, no individual stock is declining
strongly enough.
Let me show you a different approach to find potential short-selling candidates.
TradingMarkets.com has several downtrending indicators. The one I am interested
is
New Low RS
Sub-group Concentration, where you will find Telecommunications
Services as the one of the weak industries. After scanning this industry
using the same criteria as those used for the Office Equipment industry,
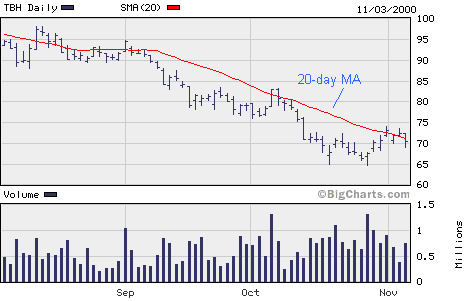
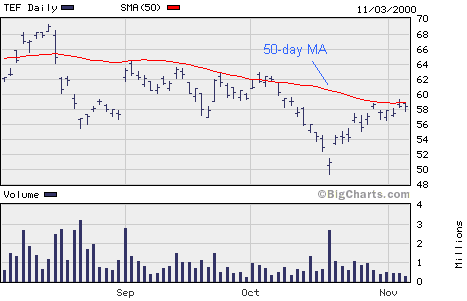
I have now two stocks for potential short sale: (TBH)
and (TEF).
TBH is bouncing down from its 20-day moving average, and TEF is failing to break
above its 50-day moving average. Both stocks look ready to test their prior
lows.
Summary
The strongest industry group is an
excellent place to look for potential buy candidates. Make sure your scanning
criteria are strict enough, so you can get only the strongly uptrending stocks.
On the other hand, finding stocks for shorting is tricky, because the
worst-performing industry does not always give us good prospects. However, one
of the downtrending indicators,
New Low RS
Sub-group Concentration, can provide us with some stocks for
potential short sale. Some days, of course, scanning the strongest industry may
not produce any good candidates for buy. Eventually, stocks will form a peak and
begin to decline. That will cause decrease in the ADX value. We have to be
flexible and sensitive to changes in market conditions.
Finally, let me show you a short cut, so you can automatically find stocks from
the strongest sector:
In his book,
Hit and Run Trading, Jeff Cooper writes
that you should pick stocks with a RS reading of 95 or higher, and choose stocks
preferably above $40 a share. I scanned for stocks that fit his criteria (I also
added 50-day average volume of 300,000 or higher)Â and received 49 stocks as a
result. Amazingly (or as expected), 11 stocks (22.4%) were from the
biotechnology industry, followed by four stocks from the business
software industry. A word of caution, Mr. Cooper says, ” My only criticism
of RS is that it will not allow you to create a short-selling list.
Unfortunately, extremely low RS readings usually are associated with stocks that
are trading for $2 or $3 a share.”Â
Good luck, and happy trading.Â
