Today’s Trading Lesson From TradingMarkets
Editor’s Note:
Each night we feature a different lesson from
TM University. I hope you enjoy and profit from these.
E-mail me if you have
any questions.
Brice
How To Use TM’s
Indicators: TM’s Nightly Plan Of Attack For Daytraders
By Eddie Kwong
Each evening, daytraders can
use TradingMarkets Indicators to quickly…
- Get a handle on the short-term direction of
the overall market. - Find the best stocks in the best sectors, and
the weakest stocks in the worst sectors.
Here is a game plan that will enable you to do
it. You can use it “as is,” or modify it to suit your trading style.
Step 1. Short-term Directional
Bias of the Markets.
To find out what direction the overall market is poised to move in:
- Click to the
Market Bias Indicators, to determine in which direction the market poised
to move. These indicators were developed by Larry Connors for his hedge fund
to determine the short-term direction of the overall market. Here is your rule
of thumb: Look for multiple signals that agree with one another. The more
signals there are, the higher the probability of an explosive short-term move!
Note that you should place more weight on the signals from the Market Bias
Indicators than the more subjective interpretations from 1b, 1c and 1d. More
advanced CVR alerts and indications for individual stocks are available at
Connors Nightly VIX And Volatility Service.Â
- Go to the
Tools And Research
page, and pull up charts of the major indices to determine the short- and
long-term trend of the market. Make a note of the trend of the
S&P 500 and the
Nasdaq Composite over the past seven days. A strongly trending market may
tell you to have more of a directional bias in your trading.Â
- Zoom in to a three-day period and change the
time frame to five-minute bars. At what price levels do you see the bounces
occurring? These may be the key “support and resistance” levels that influence
tomorrow’s trading.Â
- Look at how the market closed today, paying
close attention to the final hour of trading. Remember this: If you see
strength or weakness surging into the market in the final hour of trading,
that action could carry forward into the next trading day.Â
Step 2. Strongest and Weakest
Sectors
Find out what the strongest and weakest industry
groups are. As much as 70% of an individual stock’s movement is tied to the
industry group to which it belongs. If you’re going to better your odds, then
you want to buy stocks in a strong industry groups and short stocks in weak
industry groups
- Check the
Strongest Sectors of the Past Five Days and the
Weakest Sectors of the Past Five Days.Â
- Determine which groups are strongest and which
are weakest. As you proceed to Step 3, you should be able to see stocks within
these groups as major “themes” in the Indicator Lists. (More about this
concept in Step 3.)Â
Step 3. Finding Stocks —
Indicator Lists
Create your pool of stock candidates. To do this,
look at the
Daily Indicators page. If the market in the short-term is biased to the
upside, focus on buy candidates. If to the downside, focus on shorting
candidates.
An important point on
themes: Pay close attention to whether
many of the strongest or weakest stocks belong to the same or related industry
groups. Do these industry groups match those that were found in your sector
analysis in Step 2? If so, that serves to corroborate your big-picture analysis.
A good sign.
Here are good places to start your search:
- To
find powerful buy candidates, run through all the stocks in the
Proprietary Momentum List. For shorts, go through the
Proprietary Implosion List. Click into and look at every chart in both
daily and intraday time frames, confirming the strength of the trend and
looking for the price levels at which intraday setups may form the next day.Repeat this process with the following lists:
For Longs
For Shorts
- To find stocks that have the potential to explode
to the upside or downside, check all the stocks in the
Explosion List. These are stocks that are trading much more quietly than
usual. Through research conducted when he was managing his hedge fund, Larry
Connors found that these stocks tend to explode. While it is impossible to
predict the direction of the explosion with anything approaching 100%
accuracy, you certainly improve your odds by looking at the information that
accompanies each stock on the list.Â
- For longs, look for stocks with high
short-term relative strength, ADX readings over 30, and DMI indications that
are “Up.”Â
- For shorts, look for stocks with low
short-term relative strength, ADX readings over 30, and DMI indications that
are “Down.Â
- For longs, look for stocks with high
- To find highly volatile stocks, go to the “Trading
Where The Action Is” list. These stocks are the most volatile stocks in
our database over the past 50 days. Look at the charts and focus on those that
are exhibiting big intraday swings. Also, as with 3b, you can determine the
directional bias of each of the stocks listed by looking at the following
information.Â
- For longs, look for stocks with high
short-term relative strength, ADX readings over 30, and DMI indications that
are “Up.”Â
- For shorts, look for stocks with low
short-term relative strength, ADX readings over 30, and DMI indications that
are “Down.”Â
- For longs, look for stocks with high
- For strong candidates that have trades in the
process of forming, check
TM’s Nightly Daytrader’s Report. There you will find explosive setups
which we call Slim Jims, stocks likely to open strongly or weakly in the next
day’s trading — and much, much more.Â
Step 3a For Haggerty-Style
Traders
Kevin Haggerty developed his unique aggressive
style of trading using the insights he developed when was senior vice president
for equity trading at Fidelity Capital Markets for seven years. His perspective
gave him an edge at identifying specific patterns that are indicative of massive
institutional money flows into and out of stocks. These patterns are available
at TM and are listed below. To learn how to trade with them, take Kevin’s “Trading
With The Generals Course.”
Step 4. Finding Stocks — The
Stock Scanner
You can also find trading candidates through the
Stock Scanner. By specifying your own parameters, you can identify
additional daytrading candidates on the long and short side that meet your own
special criteria. Here is one set of parameters that will get you strongly
trending stocks with high short-term relative strength, good liquidity, and good
intraday moves. Feel free to tighten the parameters if this gets you too many
candidates. But don’t loosen the parameters. A lack of candidates may be
indicative of a market that is best watched from the sidelines.
- Closing price of 30 or higher. Higher-priced
stocks tend to have greater intraday trading ranges.
Â
- 50-day average volume of 300,000 shares/day.
To do this, you enter 3000 because the Stock Scanner automatically adds two
zeros. This enables us to get the liquidity we need for easy entries and
exits.
Â
- ADX of 30 or greater. Along with an ADX of 30
or greater, look for stocks with an “Up” DMI for longs and stocks with a
“Down” DMI for shorts.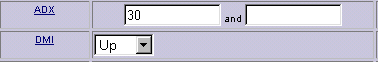
Â
- 3-month RS of 80 or higher for longs, and
3-month RS of 80 for shorts.
We’ve barely scratched the surface of what you
can do with the Stock Scanner. Play with the numbers and parameters. You will be
amazed at what you can accomplish with a small investment in time experimenting
with this tool.
Â
Step 5: Tips On Knowing When
And What To Trade
The obvious final step is to narrow the choices
to the stocks which have the highest potential reward and the lowest potential
for loss. Also, no matter how good the setups look, you need to decide whether
it’s appropriate to trade any of them, given other factors.
Here is a checklist:
- Do not trade against multiple market-bias
signals. For example, if all your stock candidates are to the long side, but
you have six CVR down signals, it’s better to focus on shorts or stay on the
sidelines.Â
- Check the news on the stocks you are
considering trading. Many traders will be cautious or not trade in front of
Fed announcements, earnings reports, or other types of major announcements.
Surprises can work both for or against you.Â
- Make sure that the buy candidates you are
considering are in the hottest sectors or industry groups and that your
shorting candidates are in the weaker groups.Â
- Be cautious when your list doesn’t contain
very many names. When there aren’t many buying candidates to choose from, it
is a sign of overall market weakness. Remember that the market is made up of
stocks. When many stocks are behaving well, there is a greater likelihood that
the overall market is healthy.