Today’s Trading Lesson From TradingMarkets
Editor’s Note:
Each night we feature a different lesson from
TM University. I hope you enjoy and profit from these.
E-mail me if you have
any questions.
Brice
Give Me Something to
Lean On: Understanding The Purpose Of Chart Patterns
By Dan Chesler
The following is
an edited transcript of a live TraderTalk workshop held by Dan Chesler for TM
members on Thursday, August 1, 2002.
Brice Wightman:
Good afternoon
and welcome to TraderTalk. Today we have with us a gentleman who holds a CMT
designation, has worked as a price risk manager for the Louis Dreyfus
Corporation, and has written articles for Stocks and Commodities
magazine. He began his career in 1988 as a cash agricultural commodities trader.
He currently is a proprietary trader for a NYSE member firm. It is my great
pleasure to introduce Mr. Dan Chesler…
Dan Chesler:
Thank you Brice, for that introduction. And thank you also to all the traders
who have taken time to join us today. Before I begin I just want to say that my
association with TradingMarkets which began in May has been a very happy one.
Most you who have been with TM for any length of time know the quality of the
content contained on this site, and the caliber of people here, are the best in
the business. It is truly an honor to work with folks like Larry, Brice, Duke,
Dave et al.
The topic of my conversation today is on chart patterns. And more generally, on
the subject of trading. Along the way to becoming a full time trader, you really
need to decide what you believe in. You can’t be without some kind of consistent
approach to the market. I’m not mechanical or “system” trader, but I do have a
set of beliefs about the market that took a few years to develop.
Without some kind of roadmap that tells you where you are in the market, you
will be lost. So my advice to any new traders is to take your time until you
find that approach or technique that really “speaks to you.” I use chart
patterns as a means of trading first, and forecasting second.
That probably contradicts what some of you believe about chart patterns. The
truth is most chart patterns are at best a 50/50 proposition. Some are a little
better than others, but overall they’re only mildly predictive. However, chart
patterns serve a very useful function for trading.
How is that? The
goal of my trading is to be involved in the “efficient” portion of the move.
That is, the portion of the market move which travels the greatest amount of
PRICE over the fewest intervals of TIME. The opposite of “efficiency” is a
market that moves sideway, with no net gain or loss.
Simply put,
chart patterns help cordon off the condition that precede this efficient action.
That is what I meant by “leaning” on a chart pattern. Chart patterns are simply
a convenient means of defining: 1. entry price; 2. risk amount; and 3. potential
target.
So again, I am simply “leaning” on a chart patterns as a means of helping me
isolate periods that precede “efficient” action, and as a means of giving me
SPECIFIC
entry, exit and risk parameters. Certainly I’d like to find a pattern that has
90% winners, with the winners three times the size of the losers. Yup. I’d love
that.
But keep
dreaming. The truth — at least in my experience — is that trading is a lot
like sales. In sales, they say if you knock on enough doors, eventually someone
will say “Yes.” Trading is similar. If you take enough trades, eventually you’ll
catch some winners. And what about all your losers?
Here’s the BIG
secret. Your losing trades should be small enough that you are able to have a
long string of losers, while not significantly impacting your trading account.
This allows you to be in position to catch the much smaller number of winning
trades that: a) make up for all your losers; and b) add significantly to your
bottom line.
Think in terms of many small losers, many “scratch” trades, and a much smaller
number of large winning trades. You make your money on these trades, just like
the salesman makes his quota on only a small percent of his total cold calls.
Different business but same theory. Again this all ties into what I am saying
about chart patterns.
The goal is NOT
to try and find that one homerun trade that will make your month or make your
year. think of your results as the SUM of MANY trades, all with very well
defined risk parameters.
So in the
patterns I am going to discuss today, I will be trying to show you patterns that
highlight ‘spots’ where prices spend a minimum amount of time “hanging around.”
Remember, this is a battle of overcoming lots of small losers. So what I’m
looking for are moves away from a “spot” where price doesn’t return anytime soon
(to stop me out or otherwise aggravate me). That’s all I care about. Direction
is almost a secondary consideration.
Two patterns which I use frequently are the
stoch-trap
(ST), and the
incipient trend pattern (ITP). In
addition, I am a big proponent of classical chart patterns. This is a very
subjective area for most folks. In my own trading, after enough years of
experience, I’ve gotten to the point where I know how to treat “subjective”
patterns as objective ones, but I’m not going to get into that topic in this
discussion. Basically it’s a technique that involves distilling the bar chart
down into separate volatility and periodicity components. Maybe we can talk
about that another day.
Stoch-trap is a
pattern that can probably best be understood in the context of a “pullback” in
an existing trend. Like other pullback strategies, it attempts to locate that
moment in time where prices have just completed a minor contra-trend reaction. I
use two indicators to identify when the market has reached this point: a trend
indicator such as the 50 period moving average or the 5/35 MACD, and the 4
period fast stochastic as a short term cycle indicator. These are pretty
standard indicators on most charting packages.
Conceptually,
think of stoch-trap as a means of identifying short-term overbought condition in
a downtrend, or conversely short-term oversold conditions in an uptrend. There
are two ways I enter the stoch-trap trade following a signal. The first method
is to place a stop at the high or low of the signal day bar (depending on
whether it’s a buy or sell).
Since we’re attempting to identify a short term cycle turning point, in theory
price should not return to the high of your entry bar (for shorts) or low (for
longs), which makes the high or low of your entry bar a convenient protective
stop level. The second and preferred method of entering a stoch-trap setup,
requires the use of intraday charts.
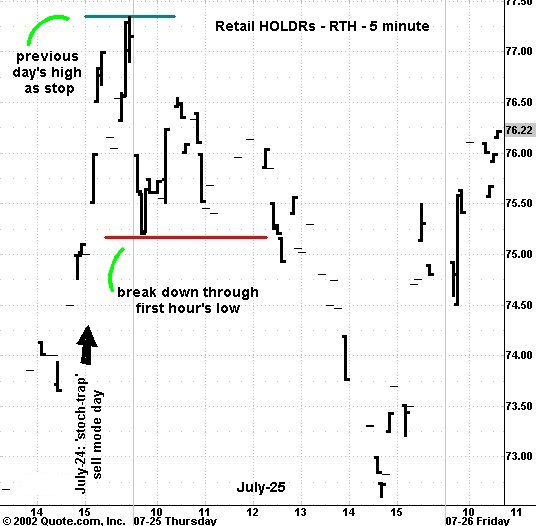
Following a buy signal, I’ll place a buy stop at the high of the first hour’s
range. Or a sell stop at the bottom of the first hour’s range for a short set
up. I prefer this entry since it gives me better precision. In markets where the
main trend is not particularly strong, stoch-trap trades may only be good for
scalps — however, in a strongly trending market like we had leading up to the
July 24 bottom, you can expect much more follow through and can hold stoch-trap
trades overnight. I’ll answer more questions on stoch-trap in a few minutes
The incipient
trend pattern (ITP) is a means of identifying “spots” (remember my discussion on
spots from earlier) where price spends only the briefest amount of time. ITP
combines the concept of early trend identification, along with a type of
‘break-out’ entry in the direction of the incipient trend. Very simply, I
qualify trend by waiting for a close above (or below) a 10 day moving average.
Following the FIRST close (above or below) the average, I then wait for the
first “contra” open-close sequence bar. For example, the first bar that closes
below its opening price, following the first close above a 10-day average, sets
up an ITP buy signal. In this case, I would be looking to buy the market on a
stop above the high of the contra bar.
I’ll give the
market up to five days (including the contra bar day) before abandoning the
trade, and will also abandon the trade if the market closes below the average at
anytime before entering the trade (penetration of the average is ok, but a close
below is not). The emphasis of both of these patterns, stoch-trap and ITP, is on
defining risk.
Both patterns
give convenient, small windows of risk which we can “lean” on — over and over.
Believe me when
I tell you. I do a LOT of scratch trades. I do a LOT of small losing trades.
Good for my broker but good for me too. Big losers = bye bye trading capital.
Just try to be in position to catch the occasional fat trade, while spending the
rest of the time playing defense. Trading is definitely not a glamorous job
despite what you may think. There have been some academic studies (University of
Michigan) that more or less confirmed the idea that the bulk of stock market
returns where the results of only a small handful of days in any given year.
This goes directly to what I was saying earlier that a) I am trading for the
efficient portion of the move; and b) the efficient moves happen a lot less
often than we wish they would.
Now, I’ll be
responding to some questions.
Wightman:
We have
some questions for you.
Chesler:
Great!
Question:
Would you
consider lowering your long entry point to above the most recent bar of the
pullback assuming there are more than 1 contra bars with lower highs, and
assuming the close is not below the average (reverse logic for shorts)?
Chesler:
Great
question. Shows this person is thinking. My answer is yes, I would consider
lowering my stop.This doesn’t happen too often, but when it does, it will allow
you to keep a smaller stop. That’s a good thing. So, again, I would lower my
entry stop in this case. Protective stop (measured in dollars) would shrink
which is good.
Question:
Dan, do you
suggest using the SMA 50 or the MACD 5/35 as the second condition for a Stoch
Trap? The Stoch Trap strategy I made for TradeStation uses the SMA 50 because
it’s slightly simpler to implement. Also, how did you choose the 5/35 MACD
numbers?
Chesler:
I’ve used them both and there’s not much difference between them. I like to use
the 5/35 MACD for bigger picture analysis, and so if I’ve got the MACD on my
charts, I’ll sometimes just leave it there rather than switching over to the 50
day average. But really it makes very little difference.
Question:
Dan, if
you don’t use charts for forecasting, what do you use? Fundamentals? Or do you
not use anything?
Chesler:
Like Austin
Powers says in his movie, “That’s not my bag, baby!” Forecasting is secondary to
trading. Trading is about making money. The only forecasting I do is in terms of
predicting whether markets are near a point where there are about to move
“efficiently” or not. I don’t care if I get the direction wrong seven times out
of ten times, so long as my losing trades are small. The other three are going
to more than make up for the losers, plus increase my account balance. I think
Brice wants to wrap up now. So thanks again for being here today and good luck
in the markets tomorrow
Wightman:
You bet. Dan, thanks for a fantastic presentation. Thanks again, Dan, and good
trading to all!