Today’s Trading Lesson From TradingMarkets
Editor’s Note:
Each night we feature a different lesson from
TM University. I hope you enjoy and profit from these.
E-mail me if you have any
questions.
Brice
Swing Traders: Find More Reliable Tops And Bottoms Using Bow Ties
Picking tops and bottoms can be costly, as
markets are prone to long-term continuation moves and false reversals. On the
other hand, blindly jumping on an established trend can also be costly, as these
markets are prone to correct. Below we will look at “Bow Ties,†a swing trade
setup which attempts to solve for the above by utilizing multiple moving
averages and a counter-trend correction.
Background
The pattern uses a
10-period simple moving average, which is simply the sum of the last 10 closing
prices divided by 10.
The pattern also
uses a 20-period and 30-period exponential moving average (EMA). An EMA weighs
current periods higher than prior periods. The theory is that recent price
action is more relevant than older price action. It’s beyond the scope of this
article to cover the calculations of this average. For details, see
Moving Averages: The Ins and Outs Of, or do as I do–forget about the
formula and have the computer do the work for you.
A simple moving
average (SMA) gives you a true picture of the average price. EMAs, being
front weighted, tend to “catch up†to prices faster. One is not necessarily
better than the other. Both have their purpose and that is why I use both in
this pattern.
Why These Averages?
I use a 10-period
SMA because it gives a true representation of the average price over the
last two weeks (10 trading days). The 20- and 30-period EMAs give a rough
representation of performance over the last month and six weeks, respectively. I
like the exponential averages for these longer periods as they are front
weighted and catch up to prices faster. These are my personal preferences, but
feel free to use your own.
Proper Order
Moving averages tend
to follow price. The faster-moving averages (shorter periods) tend to track
closest to price, whereas the slower moving averages (longer periods) tend to
lag further behind. During consolidations, prices tend to bounce above and below
the moving averages. During up trends, the faster moving averages remain above
the slower moving averages (and vise versa for downtrends).
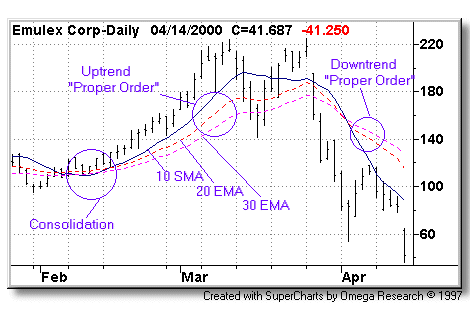
Referring to the
chart of Emulex (EMLX)
below, notice that during the consolidation, price bounces around the moving
averages–and the averages themselves are in no particular order. However, once
price begins to trend, the 10-day SMA climbs (and stays) above the 20-day EMA
and the 20-day EMA climbs (and stays) above the 30-day EMA. I refer to the
10-SMA > 20-EMA > 30-EMA as uptrend “proper order.†Conversely, for downtrends,
I refer to the 10-SMA < 20-EMA < 30-EMA as downtrend “proper order.â€
Forming The Bow Tie
Â
When a market makes
a transition from an uptrend to a downtrend (or a downtrend to an uptrend), the
moving averages converge and then spread out again–giving the appearance of a
bow tie. For this setup, ideally the convergence (the middle of the bow tie)
should be very tight (the moving averages are all close in value) and the moving
averages should spread out quickly. In other words, it should look like a bow
tie.
In a perfect setup,
the transition from proper downtrend order to proper uptrend order (or vice
versa for short sales) should take place in a maximum of three to four days.
The Setup
Here are the rules
for the setup:
For buys (short
sales are reversed).
Using a 10-period
simple, 20-period exponential and a 30-period exponential moving average:
- The moving averages should converge
and spread out again—