Today’s Trading Lesson From TradingMarkets
Editor’s Note:
Each night we feature a different lesson from
TM University. I hope you enjoy and profit from these.
E-mail me if you have
any questions.
Brice
Pinpointing Buys
And Sells Using The TradingMarkets Indicator Page And Candlestick PatternsÂ
By Tsutae Kamada
What is the
most important aspect of stealing a base in baseball? Many coaches
agree that a base runner needs to get a good jump. The next obvious question is:
How do you get a good jump? One key answer to this question is that you must
observe the pitcher’s feet closely and carefully. The pitcher has three choices
when he is in the set position: pitch, pick or step off. For a right-handed
pitcher, his right foot will move first when he decides to pick or step off. If
his left foot moves before any parts of the body, you can safely assume that he
is throwing to the plate. Once you learn this trick, your base-stealing skill
will be drastically improved.
A similar concept applies to successful stock trading. We have to observe stocks
closely and carefully if we want to develop highly effective trading styles.
Needless to say, stocks do not have feet like pitchers, but stocks give us
certain price and chart patterns. Especially if you are students of candlestick
charts, you might already have experienced how a single candlestick can identify
an important price-turning point. In this lesson, I would like to discuss how to
pick potential buys and sells from the TradingMarkets.com’s
Daily
Indicators page by utilizing candlestick charts. (Note: I will be focusing
on engulfing patterns combined with other indicators.)Â Â
Every day after market close, TradingMarkets.com reports more than 30
lists of stocks which may be tradable for the next day. But, before you get into
these lists, I suggest you first check the
Market Timing Indicators. These indicators are designed to provide you with
a picture of the overall market direction. If you see more up arrows than down
arrows, you can simply conclude that it may be wiser to look into buy
opportunities. On the other hand, if you see more down arrows, probably you are
going to face a down market. Let’s see actual trade examples for March 28,
2001.Â
As of the close of March 27, 2001, Market Timing Indicators gave me two
down arrows and zero up arrows (see below). This suggested the moderate downward
market directional bias for the next trading day, March 28. Therefore, I decided
to focus on selling and moved on to the
Downtrending
Indicators.Â
|
As of |
|
Indicators |
Directional |
Signal Date |
|
CVR I |
none |
March 27, |
|
CVR II |
none |
March 27, |
|
CVR III |
|
March 27, |
|
CVR V |
none |
March 27, |
|
CVR VI |
none |
March 27, |
|
McClellan |
none |
March 27, |
|
CHADTP |
none |
March 27, |
|
TRIN Thrust |
none |
March 27, |
|
Momentum |
|
March 27, |
There are seven stock lists in the
Downtrending Indicators. They are:
Proprietary Implosion List;
Pullbacks From Lows List;
New 60-Day Lows Double Volume List;
Implosion 10 Technology List;
Weakest Sectors of the Past 5 Days;
Stocks Crossing Below Their 50-Day EMA on Double Volume; and
Mark Boucher’s Bottom RS and EPS New Lows List. After going through each
list quickly, I found truly attractive situations in the Weakest Sectors of
the Past 5 Days. Of course, I spotted a few good setups in other lists, but
those stocks in the Weakest Sectors of the Past 5 Days exhibited
exceptionally powerful downward potential.
The figure below shows, as of the close of March 27, the weakest sector was the
Interactive Internet Index ($IIX.X),
and the second-weakest was The Street.com Internet Sector ($DOT.X).
The third weakest was the Oil Service sector ($OSX.X),
and this sector was the one with plenty of attractive candlestick chart
patterns. $OSX.X has the total of
15 component issues, and all 15 component issues indicated sell signals
after the closing of March 27.Â
Let me show you four key examples.
|
||||||||||||||
|
||||||||||||||
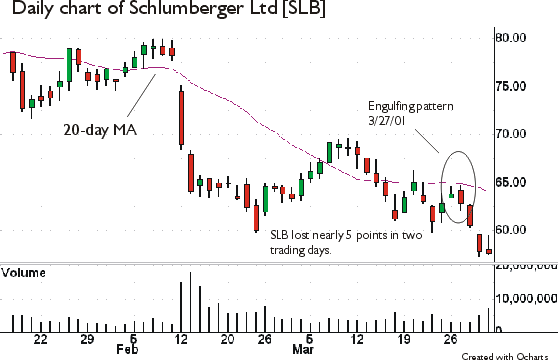
Schlumberger Ltd (SLB),
on March 27, failed to break out above its 20-day moving average after pulling
back from the March 22 low. What made this weak closing more bearish was that
the stock formed an engulfing pattern. The real body of the candlestick totally
engulfed the prior day’s real body. As you might have guessed already, my plan
would be selling SLB the next day as soon as the price falls below March 27
intraday low. Luckily, the stock continued its downward move. By the end of
March 29, the stock lost nearly 5 points.
The chart below of Cooper Cameron (CAM)
shows another excellent example of the engulfing pattern. On March 27, the stock
failed to break above its 20-day moving average and completed an engulfing
pattern. CAM continued its weakness, and the issue closed almost 5 points lower
by the end of the March 29 trading session.

Â
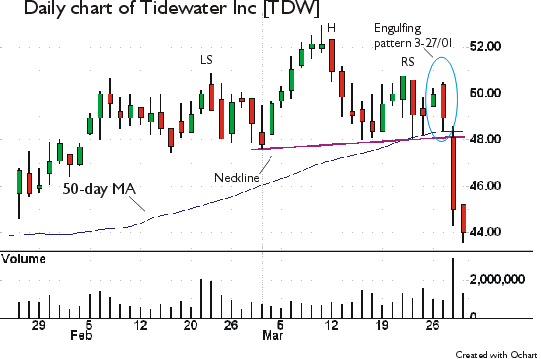
Tidewater Inc (TDW)
also formed an engulfing pattern, but its daily chart revealed additional
profitable selling signs. TDW closed just above its 50-day moving average on
March 27, and it signaled a potential breakdown play. But if you look at the
chart closely, you may notice the formation of a head-and-shoulders pattern.
Now, you have three short-selling entry points.Â
Those are:Â
-
Sell as soon as the TDW
trades below the low of the engulfing bar. -
Sell when the stock
breaks down below the 50-day moving average. -
Sell if the issue falls
below its neckline. -
As clearly shown on the
chart below, TDW satisfied all three conditions above on March 28. Needless to
say, multiple signals are always better than one — a lot better.Â
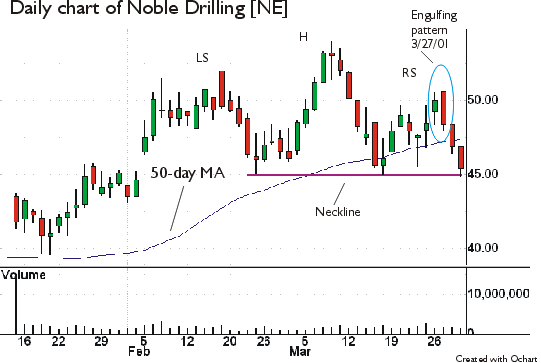
I want to show you another case of multiple entry
signals. Chart below is Noble Drilling (NE).
Like Tidewater Inc, Noble Drilling formed an engulfing pattern just above its
50-day moving average on March 27. Can you also see a formation of a head and
shoulders? Therefore, you can short the stock as soon as it violates the low of
the engulfing bar, its 50-day moving average, and the neckline. As of the end of
March 29, the stock has fulfilled two conditions, except breaking down below the
neckline.
So far, I have discussed only selling or shorting
because the Market Timing Indicators suggested the downward market bias.
Yes, there were some interesting buy setups as of the end of March 27. But as
you know, on March 28, both the Nasdaq and the Dow Jones Index suffered
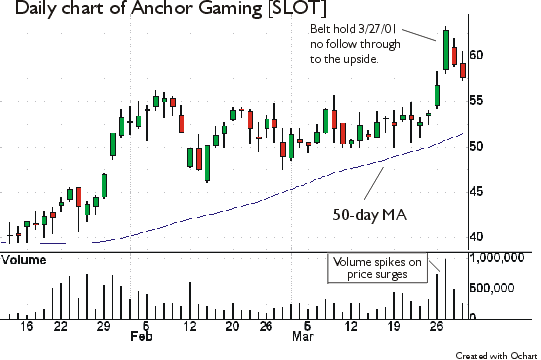
losses, and many buy setups did not produce desired results. For example, Anchor
Gaming (SLOT),
from the Proprietary Momentum List, formed a bullish belt hold and closed
at a new high on March 27. Volume was also heavy. It suggested continuation of
this upward move, but it began to pull back.
Â
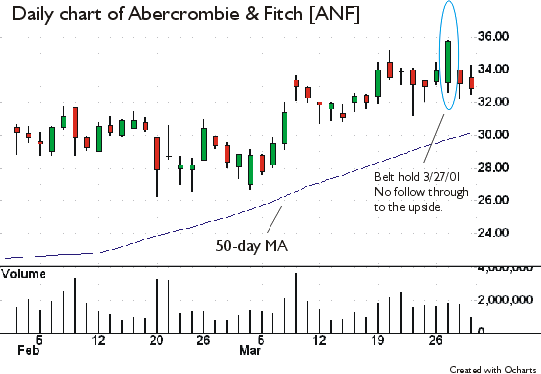
Abercrombie & Fitch (ANF),
from the Proprietary Momentum List, also
failed to follow through to the upside. Like Anchor Gaming, ANF formed a bullish
belt hold and closed at a 52-week high on March 27. I thought the stock would
continue to extend its gains, but it started to decline the next trading day.
Â
Always remember to
trade stocks with the same direction as the market. It will maximize your
profit. Also, don’t rely on candlestick chart patterns alone. As I mentioned
above, multiple signals are always better than one.Â
Let
me conclude with a quote from
Japanese Candlestick Charting Techniques by Steve Nison: “I do not use bar
charts anymore, I only use candlestick charts. But that does not mean I only use
candlestick indicators. While the candlesticks are a vital medium of market
analysis, I use all the technical tools at my disposal.”
Good luck and happy trading.
Â
For The
Best Trading Books, Video Courses and Software To Improve Your Trading
Click Here
Â