Today’s Trading Lesson From TradingMarkets
Editor’s Note:Each night we feature a different lesson from
TM University. I hope you enjoy and
profit from these.
E-mail me
if you have any questions.Brice
How To Use TM’s Indicators: The Market Bias Page
By Daniel Beighley
![]()
TradingMarkets.com
Â
TradingMarkets’
Market Bias Indicators are used to identify a potential directional bias
in the overall market, for the upcoming 1-3 trading days. While not a mechanical
trading system, these signals help the trader stay alert to shifts in sentiment
which can bring about short-time market reversals. Astute traders can use them
to index trading vehicles such as the S&P futures, QQQs or E-minis. In addition,
they can be used to improve the timing of entries into individual stocks, to
establish positions that are in sync with the overall short-term trend of the
market.
Years of research
and testing have gone into designing these market-timing indicators, in order to
give traders an “edge†in the markets. As discussed in
Connors On Advanced Trading Strategies,
Trading Connors VIX Reversals and
Dave Landry’s Swing Trading, their proper use requires an
understanding of what having an “edge†on the markets is:
Basically, when
one of the Market Bias indictors issues an alert, it is telling you that the
market has a better than 50% chance of making a short-term move in the
direction indicated.
With this alert in
place, the trader now has an “edge†on the markets. This does not necessarily
equate to a viable trading opportunity, however. Making that determination is
up to the trader’s discretion. But whatever trading setup you do identify,
knowing that the overall market has the potential to favor a certain direction
gives you an edge.
To increase your
chances of succeeding in the markets, TradingMarkets provides several different
Market Bias Indicators which issue alerts collectively. The more indicators
pointing in the same direction, the more likely the move will happen. Of course,
not every indicator is right all the time, and in some situations, the markets
will move contrary to these alerts.
The indicators can
be used for any style of trading. Each signal is designed to forecast the market
direction, until it signals otherwise. Swing traders can use the momentum to
better time their entries and exits, while daytraders can better predict the
next day’s momentum. Using stocks from the
Proprietary Momentum List and
Proprietary Implosion List will also increase your edge. Having a solid
money management system is also a crucial aspect of success with the indicators,
although that’s a topic for another lesson. For a deeper understanding of the
workings of each
Market Bias Indicator, just click on the links below.
Indicators Defined
The VIX is a measure
of the consensus estimate of future volatility, based on “at-the-money” quotes
of OEX index options. This is basically a measure of sentiment, with low VIX
readings reflecting complacency and high VIX readings reflecting fear in the
markets. Low VIX readings typically occur when the market is rising, and high
VIX readings typically occur when the market is falling. The signals given by TM
are discussed thoroughly in the book
Trading Connors VIX Reversals by Larry Connors and Greg Che.
Connors VIX Reversal II CVR II
Connors VIX Reversal III CVR III
Connors VIX Reversal VI CVR VI
The
McClellan Oscillator is a popular instrument that measures breadth by taking
the number of advancing issues, less the number of declining issues, and
subtracting the 39-day EMA from the 19-day EMA of net advances. When the 19-day
EMA has crossed above the 39-day EMA, advancing issues have gained the upper
hand. Conversely, when the 19-day EMA has gone below the 39-day EMA, declining
issues are in command. For the Market Bias page, an up arrow signifies a
McClellan reading of -100, which is oversold, and a down arrow signifies an
oversold condition with a reading of +100.
The Connors-Hayward
Advance/Decline Trading Pattern,
CHADTP, is a proprietary indicator that measures the NYSE’s
advancing/declining issues, to identify short- to intermediate-term overbought
and oversold conditions in the stock market and the S&P 500 futures. When the
CHADTP is above +400, the market is overbought; when the CHADTP is below -400,
it is oversold. Possible reversals are indicated when the indicator ticks down
when it is overbought or ticks up when it is oversold.
The TRIN is the
short-term NYSE Trading Index, generated by combining advancing and declining
stocks with volume. Readings under 1.00 signify a strong market; readings above
1.00 signify a weak market. A
TRIN-Thrust day (a change of .30 or more) signifies the likelihood of some
market follow-through the next day. An up-move of .30 or more indicates the
market has a downward bias for the upcoming day; a down-move of .30 or more
signifies an upward bias for the upcoming day. TRIN Thrusts are not to be used
as a stand-alone indicator. They should be combined with another indicator (or
indicators) that also points to a move in the same direction.
The
TradingMarkets.com
Momentum Index Indicator uses a proprietary mathematical formula to create
an unweighted basket of the strongest stocks — those the “smart money” is
moving into. These stocks tend to front-run the overall market by a day or less.
This means if the overall market is down for the day and the TMI closes higher,
there is a better-than-average chance the overall market will be higher the next
day. Conversely, if the overall market is up for the day and the TMI closes
lower, there is a better-than-average chance the overall market will be lower
the next day.
Examples
*All charts use the following symbols:
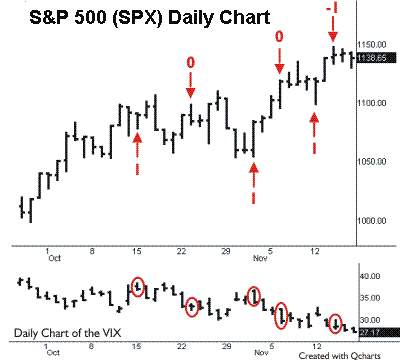
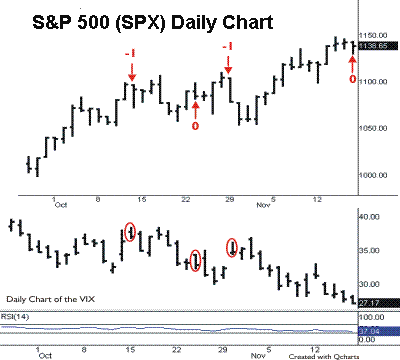
1 = Buy Signal, -1 = Sell Signal, 0 = Exit
Position.
The accompanying rules are from the
book
Trading Connors VIX Reversals by Larry Connors and Greg Che.
In the first
example, we have a CVR I signal marking buy and sell points on the S&P
500 Index.

As you can see, the
signals alerted us to shifts in the market that were potential entry points.
Some of the signals obviously worked better than others, though the edge here is
evident. The original design of this signal was tested and recommended with
these rules:
For Buys (Reverse
for Sells)
-
Today the VIX must
make a five-day high. -
Today the close of
the VIX must be below the open. -
If Rules 1 and 2
are met, buy the S&Ps (or the market) on the close of today. This will have to
be done at the same time Rule 2 is met in the last few minutes of trading. -
Hold the position
at least 1-3 days.
Though the original
design was for swing traders, daytraders can easily incorporate these signals
into a strategy by anticipating potential market direction.
In the second
example, we have a CVR II signal.

Here we see choppier
price action following the signals, which reinforces the importance of stop
losses. These signals are from the same time period of the first example, yet
are signaling different entries. The advantage of having different VIX signals
generated is that it can take advantage of different market climates. Any
indicator can outperform or under-perform the others at any time, so it is
important to tune into all of them to try to get as clear a picture as possible.
Multiple signals in the same direction increase the chances of that move. The
rules for CVR II signals were designed with the following recommendations:
1. Take a five-period RSI of the
closing VIX.
2a. When the
five-period RSI gets to 70 or above, it signifies the VIX is overbought and
the market is oversold.
2b. When the
five-period RSI of the VIX gets to 30 or below, it signifies that the VIX is
oversold and the market is overbought.
3. When a daily
RSI reading above 70 is followed by a downtick in RSI, buy the market that day
on the close. When an RSI reading below 30 is followed by an uptick in RSI,
sell the market that day on the close.
4. Exit 2-3
trading days later (or use some type of trailing-stop exit).
In the third
example, we have a CVR III signal.

As you can see in
the chart above, the indicators are providing desirable entries. Again, a good
money management system can make all the difference in your level of success
with these indicators. When you exploit an edge on the market, you must also be
disciplined enough to exit the trade when your stop-loss has been hit. The rules
for these signals were recommended with the following:
For Buys (Reverse
for Sells):
-
Today the low of
the VIX must be above its 10-day moving average. -
Today the VIX must
close at least 10% above its 10-day moving average. -
If rules 1 and 2
are met, buy the market at the close. -
Exit (on the
close) the day the VIX trades (intraday) below yesterday’s 10-day moving
average (reversion to the mean), or exit within 2-4 days.
In our fourth example, we have a
CVR VI signal.

The signals here are
demonstrating entry points that are once again setting up profitable moves. Does
this work all the time? No. The first -1
sell signal in this example was reinforced with other CVR signals cited in the
examples above. The signals may not all trigger on the same day, but by looking
at the Market Bias Indicators page every day, you will get a good feel for
what’s going on as the signals come in. The rules for the CVR VI were
recommended with the following:
For Buys (Reverse
for Sells):
-
The VIX must make
a new 20-period high two out of the past three days. -
When this occurs,
buy the market on the close. -
Exit in 2-3 days.
Summary
Good money
management is essential with any trading methodology. Reliable as these signals
may be, trading off Market Bias page alerts is no different. Remember that these
alerts are designed to give you an edge. We cannot emphasize enough that
multiple signals provide even better odds than individual ones.
While this edge can give you an advantage
when it is factored into your trading decisions, no system is perfect. For best
results, you must adjust numerous factors such position size, entry levels, stop
placement, etc.
For The
Best Trading Books, Video Courses and Software To Improve Your Trading
Click Here
