Too Hot to Handle?
When a market sells off after a strong move higher, what kinds of stocks are traders selling?
If you are the kind of trader who looks to buy weakness and sell strength, it is worth making sure that the strength you sell is the strength of weak stocks temporarily masquerading as strong stocks. When a stock that has been trending lower, trading below its 200-day moving average, suddenly starts moving higher, veteran traders know that these are stocks that tend to fail and are often best avoided, or sold short.
After a certain point in a rally, regardless of the stock, everyone who is apt to buy has done so. And those who bought much earlier on are looking to take profits. This is all the more so with beaten-down stocks, stocks trading below their 200-day moving averages. When these stocks begin to rally, those who had been holding the losing positions are often all the more eager to exit with at least some of the losses recouped.
This is what we see happen often in the land of stocks under the 200-day moving average: failed bounces, feeble rallies, false bottoms as truly bad stocks get worse.
Click here to read our research into trading stocks above and below the 200-day moving average.
Using the 200-day moving average is the first part of an effective way to spot opportunities to buy and sell stocks. When it comes to overbought stocks to sell, stocks that have in essence moved too far too fast, the first step is to recognize whether or not the stock is below the 200-day moving average. If so, then the stock can be considered one potentially worth betting against.
The second part is a way to determine when a stock truly has gone too far too fast. For this we use a technical indicator, the Relative Strength Index, that is widely used by technical analysts. However, we make two important changes to the traditional RSI to make it a much more effective indicator for short term stock traders.
The first change is to make the indicator more sensitive to short-term price movement. We do this by changing the RSI from the traditional 14-periods to 2-periods.
The second change is the raise the bar for overbought and oversold conditions. If we are betting against a stock that is moving higher, then we need some evidence that the stock has reached a truly extreme level. The traditional RSI suggests that this extreme level to the upside, for example, happens when the indicator, which runs from 0 to 100, reads 70. We think that a truly extreme, overbought market, a market that has truly moved too far too fast, is a market in which the RSI is much higher, such as 98 or more.
Our quantitative research backs this up. We did a study involving millions of simulated trades between 1995 and 2007. We found that stocks that were trading below their 200-day moving averages, and had 2-period RSI values of more than 98, underperformed in one-day and one-week time frames.
To read our research into trading stocks using the 2-period RSI, click here.
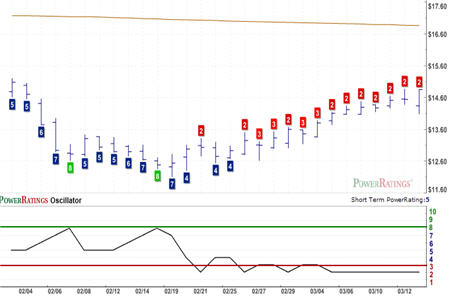
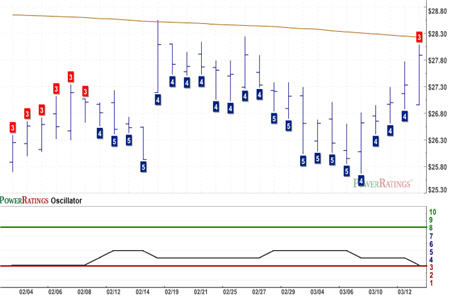
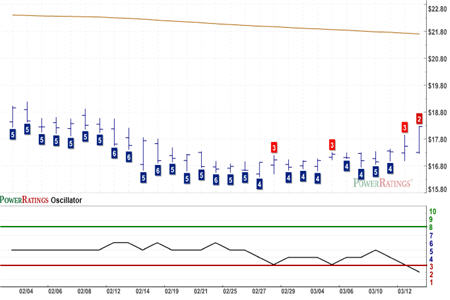
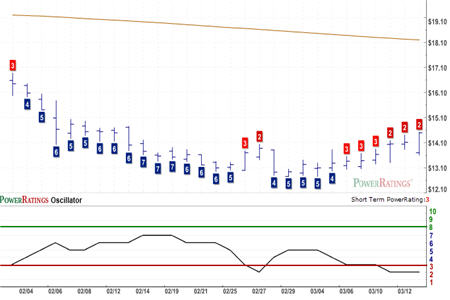
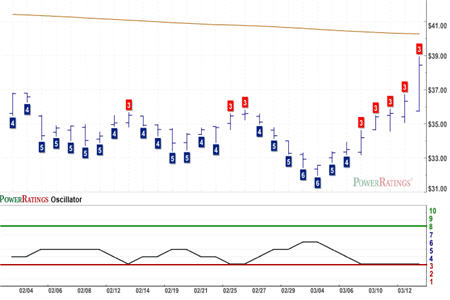
All five of the stocks below have 2-period RSI values of 98 or more. In addition, they are all what we consider “weak” stocks insofar as they are also trading below their 200-day moving averages. This is the necessary combination of weak stocks experiencing temporary strength that makes for profitable trades to the downside.
Epiq Systems
(
EPIQ |
Quote |
Chart |
News |
PowerRating)
IPC Holdings
(
IPCR |
Quote |
Chart |
News |
PowerRating)
Lance
(
LNCE |
Quote |
Chart |
News |
PowerRating)
Pike Electric
(
PEC |
Quote |
Chart |
News |
PowerRating)
Thomson
(
TOC |
Quote |
Chart |
News |
PowerRating)
Does your stock trading need a tune-up? Read our special, Free Report, “5 Secrets to Short Term Stock Trading Success” for a refresher course on not just why to buy low and sell high, but specifically how you can use intraday weakness in the market to do so. Click here to get your copy of “5 Secrets to Short Term Stock Trading Success” or call us today at 888-484-8220.
David Penn is Senior Editor at TradingMarkets.com.